Chart watchers know that a slump in the market capitalization of banks can sometimes give early warning of a decline in broader equity indices. However, divergences between the bank indices and the larger market can persist for several months before equities finally roll over. In the right circumstances, Elliott wave analysis of these intermarket divergences sometimes can provide additional information about timing the turns.
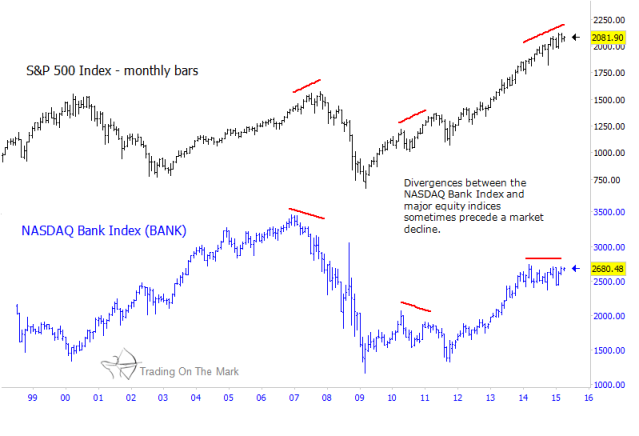
The NASDAQ Bank Index (BANK) represents the stocks of several hundred NASDAQ-listed banks. On the long-term chart below, which shows the price history of BANK along with that of the S&P 500 Index, note that the S&P 500 experienced declines starting in 2007 and 2011 following periods of divergence with the bank index.
S&P 500 vs NASDAQ Bank Index Performance Chart: 2000 – Present
Since late 2013, BANK has been unable to rise above resistance even while the S&P 500 and other major indices advanced. Although the recent divergence does not look quite like the divergences of 2007 and 2011, it may prove to be just as significant because the NASDAQ Bank Index may be nearing pattern completion.
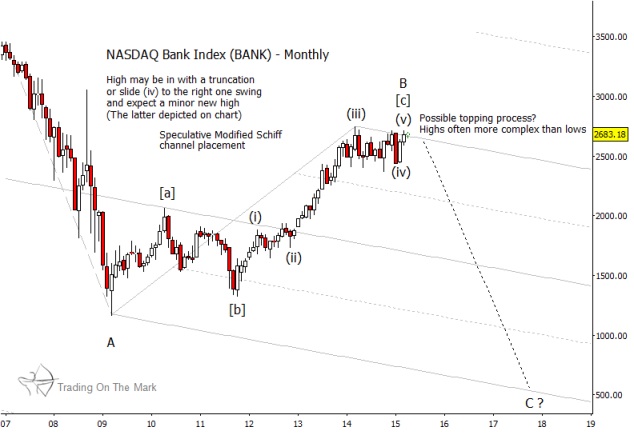
On the monthly chart below, we show how we count the entire climb in the bank index since 2009 as an intermediate B wave – a pattern that typically has an internal structure of [a]-[b]-[c]. In that structure, the final leg [c] should consist of five waves, which appears to describe the rally since late 2011.
We also have placed a long-term Schiff channel on the monthly chart in a way that aligns with the major turns since 2009. The index currently is testing the upper boundary of that channel, which is acting as resistance.
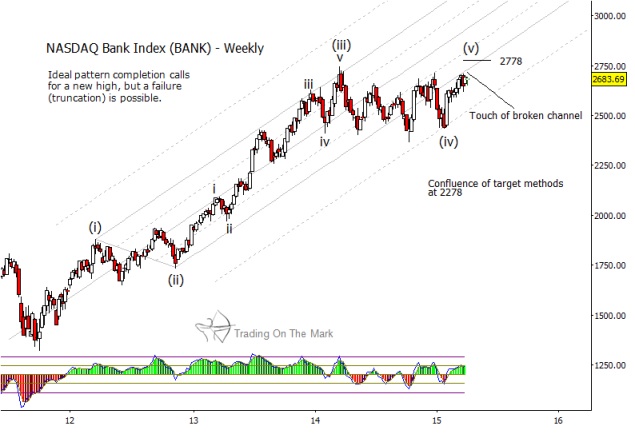
While it is not clear from either the monthly or weekly BANK charts that the final sub-wave (v) of [c] is complete, we believe there is a significant risk that the index could turn downward from near its current price. In addition to the resistance implied by the channel on the monthly chart, we see that price has fallen out of the guiding channel on the weekly chart. Now it is testing the lower boundary of that channel from below. This presents a scenario where the final stages of the wave count could become truncated, allowing the index to fall from resistance without first reaching a new high.
Our interpretation of other major U.S. and European stock indices suggests that they also have been in a topping process during the first part of 2015, and some of them may already have begun the path downward. Developments in the NASDAQ Bank Index are consistent with that forecast.
If BANK succeeds in reaching a new high for the decade, there still is important Fibonacci-related resistance at 2,778 – not far from the current price.
You can find original predictive analysis of several major U.S. equity indices in our forthcoming eBook, which will be available at our website and through Amazon.
Thanks for reading.
Follow Tom & Kurt on Twitter: @TradingOnMark
No position in any of the mentioned securities at the time of publication. Any opinions expressed herein are solely those of the author, and do not in any way represent the views or opinions of any other person or entity.


