THE BIG PICTURE – What Lies Ahead?
The major stock market indices closed above their weekly open prices last week (recap which may be found here) with Nasdaq (INDEXNASDAQ:.IXIC) soaring to new all time highs in week 17, and the S&P 500 (INDEXSP:.INX) not far behind. This is yet another sign of the relentless uptrend that traders have been apart of for quite a while now.
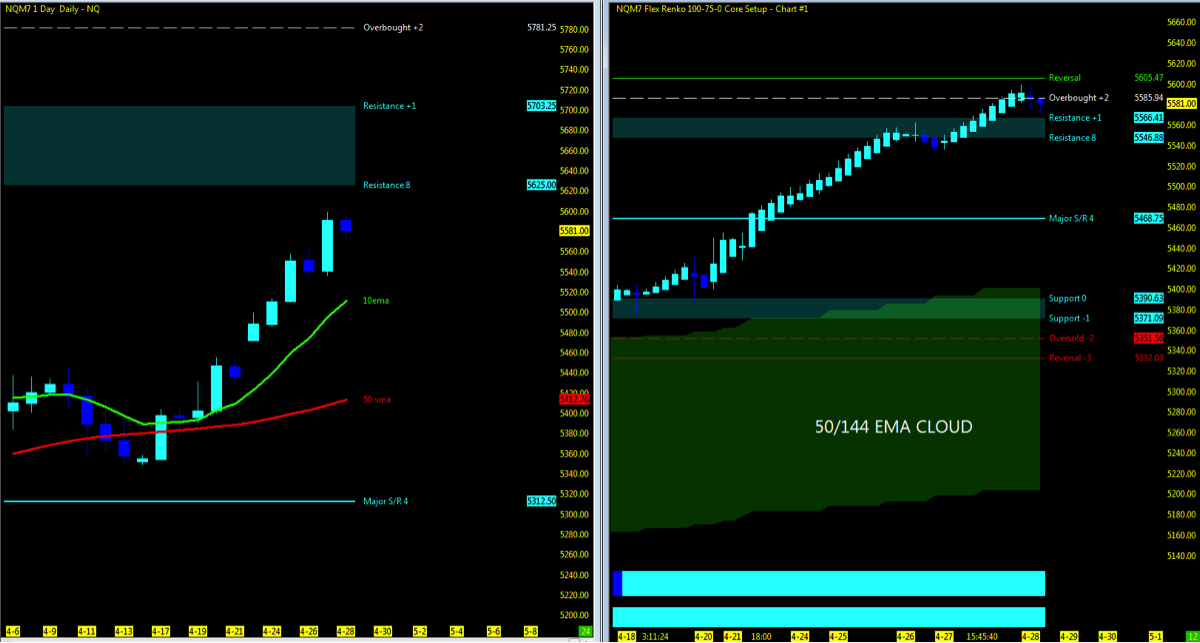
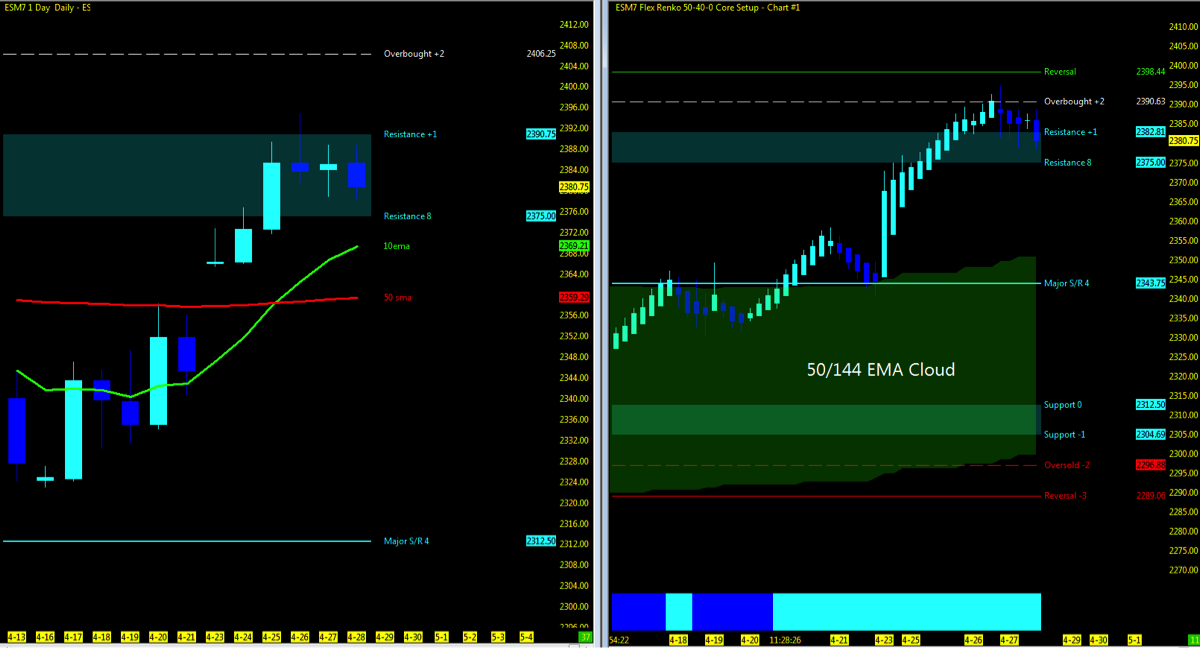
It’s notable that each of the stock market futures indices (and cash indices) are holding above their 50/144 ema on the range charts.
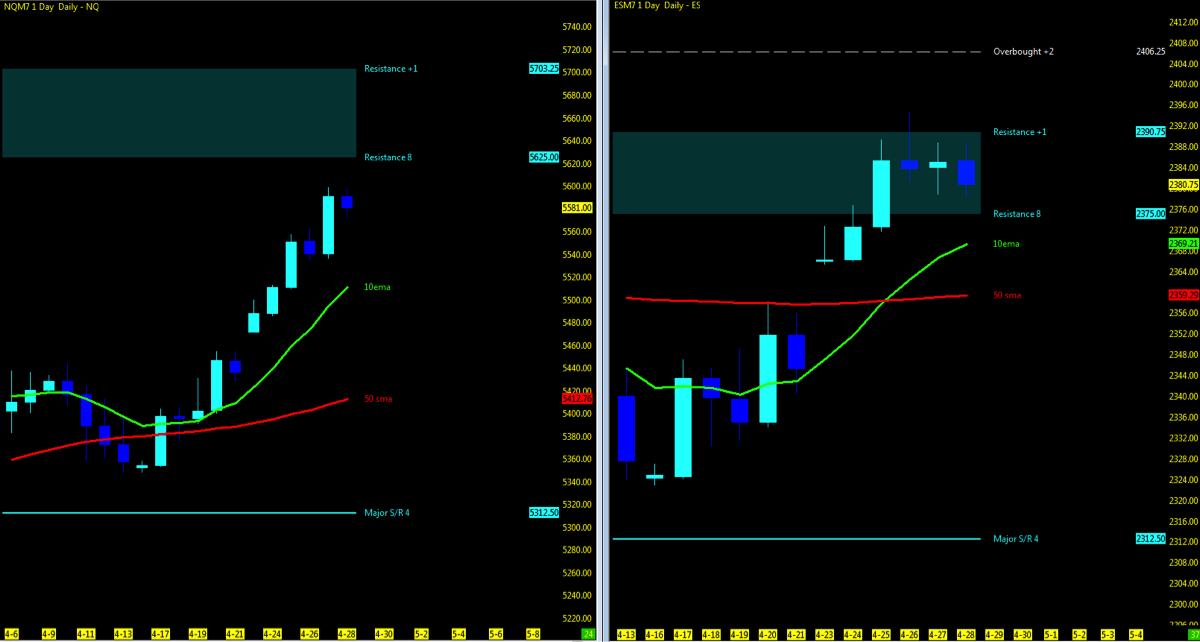
Here’s a look at the action on the S&P 500 Futures (ES) and Nasdaq Futures (NQ):
Volatility Index (INDEXCBOE:VIX) levels closed out even lower than last weeks levels. The VIX now holds in the high 10’s.
With price action now back above the 10/50 day ma’s, traders have turned their attention on the S&P 500 and Dow Jones futures to the all time highs seen back in March. But any pullback may aim at the open gaps below. With no previous reference points on the NQ, daily volume profile and Murray Math levels or Fib extension/projections may be used to determine upside resistance in momentum. Any pullback will surely test the support levels and even close out an open gap or two. Keep in mind that institutional support remains well below at the 200 day ma which will take numerous levels to breakthrough to push downside.
Is the market overbought? Sure, but are you not tired of the continued stream of market apocalypse? I agree with many that at some point it will draw down and self correct but attempting to pick out the top is simply a lottery of wannabees that will say they told you so when it finally occurs. So, they just continue to publish it week, after week. The technical charts which are the foundation for this intraday trader for both directions and while a daily pullback here and there may be found, the overall big picture remains upside until otherwise.
Key events in the market this week include FOMC announcement, APPL/FB earnings, Yellen, Payroll, Upcoming French Elections and North Korean instability. Throw in Washington politics and economic reform and we have a week of sure uncertainty that lies ahead.
Note that you can also view my market outlook on YouTube. Markets Covered: ES, YM, NQ, GC, CL
THE BOTTOM LINE
Key Events will most definitely play a roll in price momentum this week. To the upside, the YM and ES to regain and ring the all time high bell last seen in March. The NQ with MML levels just above on the higher timeframe surely could be a carrot dangling ahead. Momentum to the south can also turn on a dime in key events which may easily test the 10 and 50 period moving averages as well to close out the two open gaps from week 17.
Attempting to determine which way a market will go on any given day is merely a guess in which some will get it right and some will get it wrong. Being prepared in either direction intraday for the strongest probable trend is by plotting your longer term charts and utilizing an indicator of choice on the lower time frame to identify the setup and remaining in the trade that much longer. Any chart posted here is merely a snapshot of current technical momentum and not indicative of where price may lead forward.
NQ – Nasdaq Futures
Technical Momentum: UPTREND
Using the Murray Math Level (MML) charts on higher time frames can be a useful market internal tool as price action moves amongst fractal levels from hourly to daily charts. Confluence of levels may be levels of support/resistance or opportunities for a breakout move.
CHARTS: Daily; Range
Nearest Open Daily Gap: 5512.75, 5449.75
Lowest Open Gap: 4017
ES – S&P Futures
Technical Momentum: UPTREND
Nearest Open Daily Gap: 2374, 2353
Lowest Open Gap: 1860.75
Thanks for reading and remember to always use a stop at/around key technical trend levels.
Twitter: @TradingFibz
The author trades futures intraday and may have a position in the mentioned securities at the time of publication. Any opinions expressed herein are solely those of the author, and do not in any way represent the views or opinions of any other person or entity.


