 By Brad Tompkins
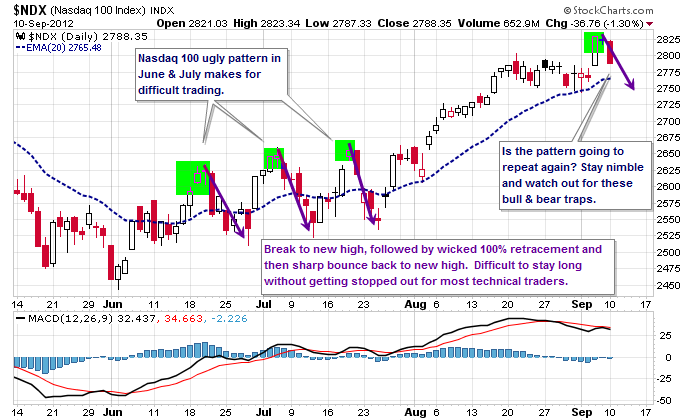
Most technical traders have a favorite chart pattern that is the trading equivalent to a “fat pitch” in baseball. We see it setup and then swing for the fences. This 4 month Nasdaq 100 Index (NDX) day chart below displays a repeating pattern that is the opposite of a favorite pitch. It is more like a wicked change-up that results in an embarrassing whiff as the batter is way out ahead of the off speed ball.
This past summer, NDX caused more than a few of those swing and misses. It would break to new highs sucking in all eager bulls, then brutally retrace 100% of the recent move trying to shake them out as well as get bearish traders to jump in on the downdraft. Then just as quickly, NDX would bounce right back up to new highs chewing up the bears too. The end result is that day chart traders with tight stops got chopped to pieces and possibly weren’t around in August when NDX made a nice sustained move higher. Today’s price action may be the start of another similar rough sequence of bull and bear traps.
Trading, like hitting in baseball, requires adjustments. When facing an ace pitcher that likes to keep batters off balance, a suggestion is to choke up on the bat and hit for singles instead of homeruns. Similarly, when trading a choppy market environment that likes to keep traders guessing, you might consider shortening your timeframe. Short term momentum trading is my version of “small ball.” The goal is to accumulate a series of smaller profits and minimize losses. The nimble strategy is based on these steps:
· Enter trades on momentum breakouts.
· Have a fairly close initial stop and move to breakeven or better as quickly as possible. [Minimize losses!!]
· Take partial profits as soon as momentum stalls and exit the remainder of the position with a tight trailing stop.
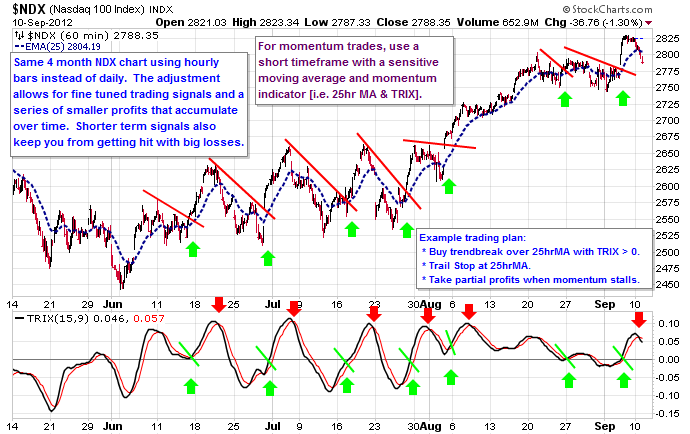
The above hourly NDX chart shows a sample momentum trading plan that allows for navigating a choppy market that can give daily chart traders fits. It defines tradable momentum breakouts by the combination of:
1) a break above a trendline (line drawn using a pivot price > 25hr moving average).
2) price trades over 25hrMA line and last pivot price.
3) confirmed by a positive momentum indicator (TRIX > 0).
Don’t forget that a solid momentum trading plan also has to account for stop losses and the potential for taking early profits. This example strategy uses a trailing stop loss at the 25hrMA and displays momentum slowdowns which trigger early profit taking by TRIX turning down and crossing its moving average. The momentum strategy applies to higher beta markets where the thrust moves are sizeable and fairly decisive.
Of course, all of the parameters are subjective and you’ll want to get comfortable with a set that fits your personal style. The important fundamentals to keep in mind are to accumulate profits as the market shows signs of positive momentum and manage risk when the momentum subsides. Taking early profits reduces overall position size plus the use of a shorter timeframe moving average provides a sensitive stop loss point. Both of those work together to aggressively reduce risk exposure. The result is that you’ll be able to participate in market upswings and safely out of the way during downswings. Trade well.
See Also: 15 Investing Lessons Learned From Playing Fantasy Football
———————————————————
Twitter: @BBTompkins and @seeitmarket Facebook: See It Market
Position in NDX futures at the time of publication.
Any opinions expressed herein are solely those of the author, and do not in any way represent the views or opinions of any other person or entity.


