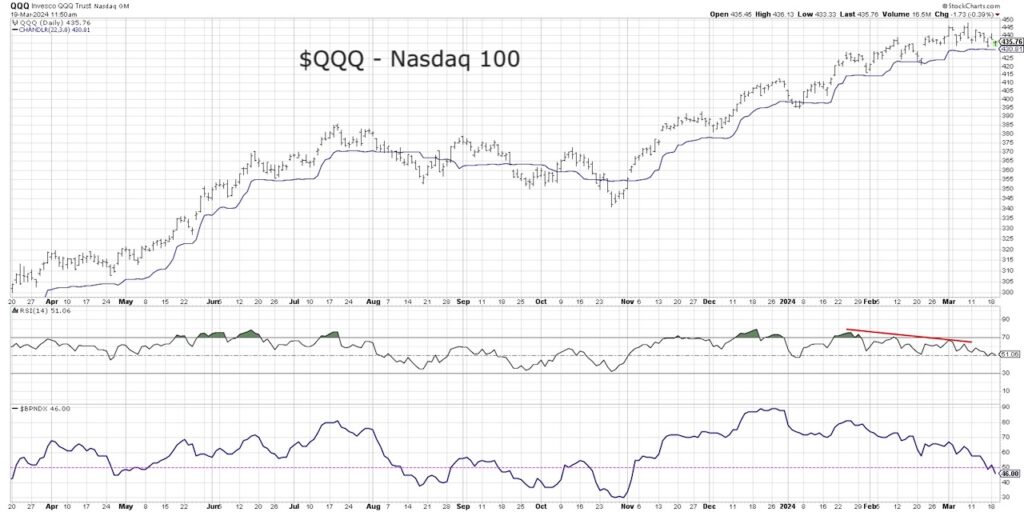
The Nasdaq 100 ETF (QQQ) is beginning to show further signs of deterioration, from bearish momentum divergences between price and RSI to weakening breadth using the Bullish Percent Index.
How can we determine whether a pullback could turn into something more disastrous for stocks? And what would be the Nasdaq 100 downside risk?
When a bull market top is nearing an exhaustion, we tend to see bearish divergences as prices move higher but on weaker momentum. Think of a steam train getting to the top of a hill, slowly running out of energy as it nears the top. Breadth conditions can speak to “internal” weakness for a market index, as we can measure the performance of all the individual Nasdaq 100 members in aggregate. Higher price highs on weaker breadth often tells you that there are plenty of stocks that are not participating in the recent rally.
In today’s video, we’ll look at how the 50-day moving average, Chandelier exits, and Fibonacci retracements can help anticipate $QQQ Nasdaq 100 downside risk.
By following the movements in these charts over the coming weeks, investors should be able to better manage potential downside risk for stocks!
- What would a break of the 50-day moving average tell us about short-term price weakness, and how does that compare to the Chandelier exit system?
- How can bearish momentum divergences give us an early warning of a potential downside reversal, and where are we seeing these signs today?
- What downside objectives can we identify using Fibonacci Retracements and other price-based indicators?
Video: How Far Could The Nasdaq 100 ETF (QQQ) Fall?
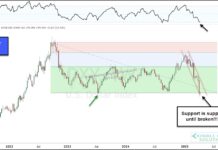
$QQQ Nasdaq 100 ETF Chart

Twitter: @DKellerCMT
The author may have positions in mentioned securities at the time of publication. Any opinions expressed herein are solely those of the author, and do not in any way represent the views or opinions of any other person or entity.


