Before we begin, just a note to mention that TLT took out the fast MA featured in the October 10th Daily Update, while SPY underperformed. If that is a trend, it behooves you to review that Daily.
Loyal readers of the Daily know that we often focus on zooming out to longer timeframes to assess bigger trends.
Clearly, the 80-month moving average in small caps and retail has become an important support “line in the sand” to measure the potential for recession and/or stagflation.
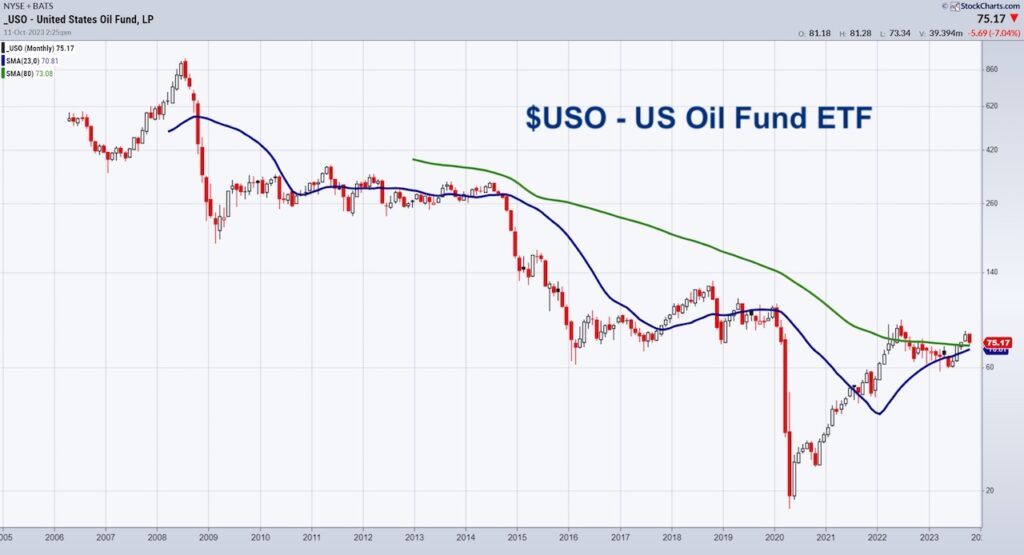
In the case of the chart of USO (US Oil Reserves), the 80-month moving average is a line in the sand to measure the inflation narrative or higher oil prices likely coming.
Historically, the 80-month moving average (green line) served as resistance in USO since 2008 when the market crashed.
Then, from March 2022 until July 2022 USO traded above the 80-month MA.
However, that was short-lived thanks to rising interest rates.
3 months ago, that changed.
Once oil cleared $80 a barrel, we saw the price spike to about $94.00.
USO then cleared the 80-month MA in August on the heels of OPEC+ and the US dwindling oil reserves, plus higher than expected demand.
The oil market appears to have priced in current interest rate values.
Although the current geopolitical situation is not a pure impact on oil prices, what the chart suggests is that lack of impact can reverse to a much larger impact.
The USO price closed the month of September at 76.00.
This month, USO opened higher. Currently, the price is above the 80-month but slightly below a pivotal point at 76.00.
Quite simply, a move over 76 suggests higher prices with a good risk point to under 73 or the 80-month MA.
That would correspond with oil holding $80 per barrel and returning above $86.00.
More importantly, if the trend is your friend, this break higher of the 6-7 year business cycle if sustains, should drive oil prices to the next target of around $110.
Twitter: @marketminute
The author may have a position in mentioned securities at the time of publication. Any opinions expressed herein are solely those of the author and do not represent the views or opinions of any other person or entity.


