I like to look at price spreads, particularly spreads between related assets.
When they become too wide, they point to a strong potential for mean reversion (and an opportunity for investors).
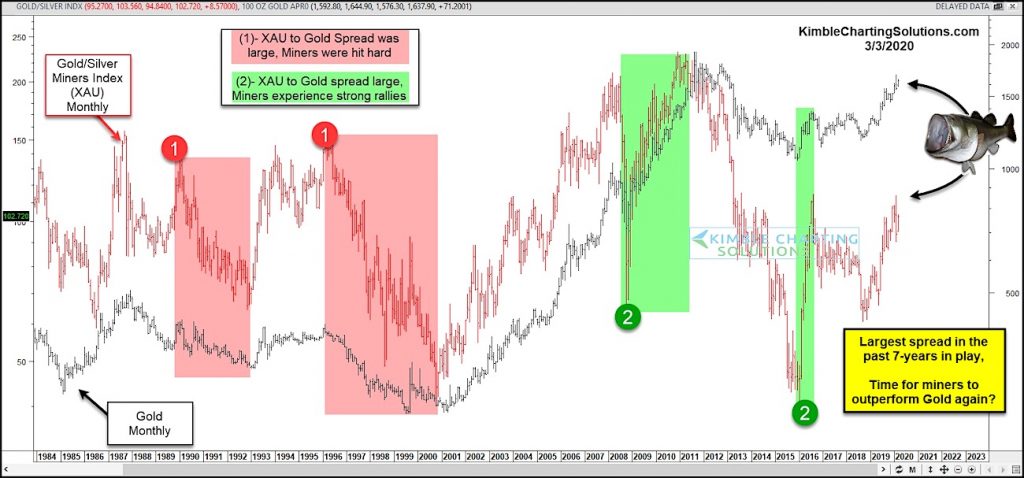
Today, we look at the spread between the Gold/Silver Miners Index (XAU) and Gold prices.
As you can see in the chart, the spread between gold and the XAU is the widest in years.
When XAU (miners) is outperforming Gold and the spread is wide (at each 1), the miners tend to underperform.
BUT when the miners are underperforming and the spread is wide (like it is now), there is strong potential for the miners to play catch-up. The last two times this took place at each (2), the miners did VERY well.
XAU Gold/Silver Mining Index versus Gold Performance Chart

Note that KimbleCharting is offering a 2 week Free trial to See It Market readers. Just send me an email to services@kimblechartingsolutions.com for details to get set up.
Twitter: @KimbleCharting
Any opinions expressed herein are solely those of the author, and do not in any way represent the views or opinions of any other person or entity.


