By Brad Tompkins
If you are trying to determine the current market disposition through popular financial media, you are hearing a great deal of contradiction. For instance, if twitter streams were able to produce a market weather forecast it would be something along the lines of “Positively Sunny with a Chance of Torrential Downpour.” The voices coming from the news and opinion feeds are definitely not in synchronized harmony and volume of one over the other at any given time does not equate to veracity.
Sunny = Market Price Highs
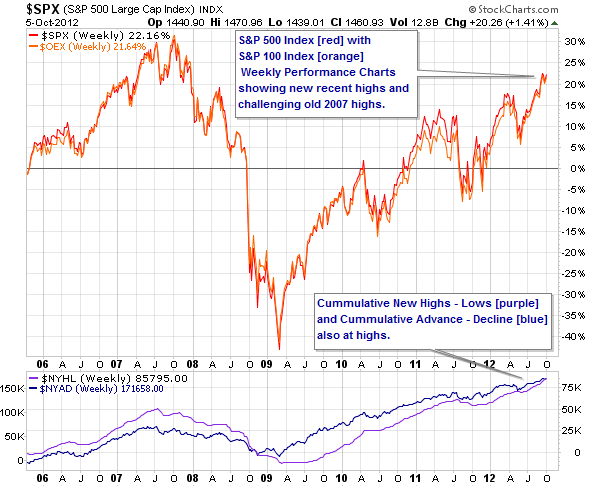
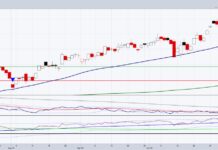
Let’s attempt an assessment of the current state of the longer term equity market. First the good news charts. The US Market indexes (S&P 500 shown below) are at recent highs and not far off the 2007 peak prices. In addition, market breadth indicators are in agreement with the stock market enthusiasm. So far, so good.
Divergence = Clouds on the Horizon
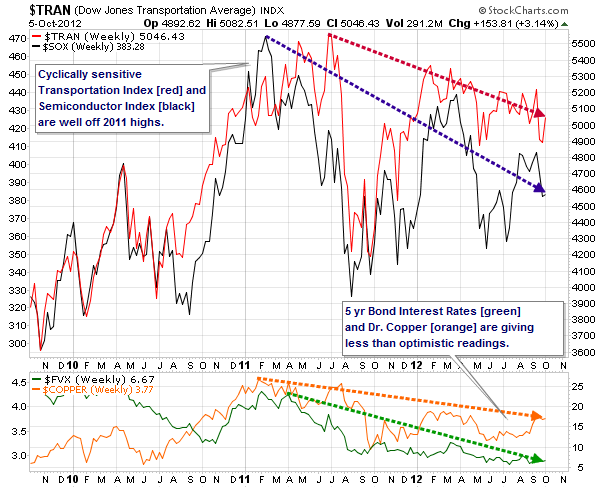
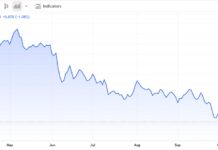
In spite of the impressive market advances, we see numerous deviations and disagreement in other market measures, economic reports and social news. Here’s a chart of the Transports and Semiconductor sector prices along with Bond Interest rates and Copper Commodity that display a differing opinion from the market’s excitement. In normal circumstances, we’d have to be alarmed by this collection of recessionary foreshadowing, but as we’ll discuss in a minute, these are extraordinary times.
We also can look to broader economic reports and see storm clouds in the distance. August durable goods order numbers were horrendous and economic growth adjusted for inflation is anemic at 1.3%. If those are the beginning of an ominous downtrend, then personal income and corporate earnings are going to take a hit as well and ultimately cause market participants to duck for cover. Yet another check box gets marked for severe correction possibility.
Social divergence is another arena where we are getting conflicting readings with possible market implications. All it takes is a quick scan of the headlines to see a rise in social friction here and abroad. Do a news search for these phrases if you need proof of social disorder: “Foxconn Riot,” “Mideast Tensions,” “European Protests,” “Fiscal Cliff,” and “OWS”. It is difficult to quantify sentiment as well as gauge its direct impact on market pricing. Regardless we can’t ignore the significance of collective discord.
Bulls and bears alike have plenty of fodder to fuel their respective fervors. It is hard to argue with prices making highs but can the trend continue in light of the increasing case otherwise? The short answer is yes it can. For related commentary dealing with the topic of overextended market conditions please reference “Overbought or Not Overbought: Does It Really Matter?” In similar fashion, divergence at these market prices far from support zones justifies increased risk awareness, but in terms of setting trading strategy it can’t be the center of our attention. Granted, we have seen recent distribution days where SPX peeks over 1460 early and is met with heavy selling the rest of the day. However, until price truly breaks down we have to treat that action as healthy consolidation and be open to the prospect of prices grinding higher.
Above, I alluded to the atypical situation we are in. It appears that there are two massive opposing forces locked in battle– global liquidity operations (cash floods into equity markets) vs. a painful deflationary debt hangover (reduces all asset values). Nobody can predict the shorter term outcome of this financial tug of war. This chaos is likely to persist until either unlimited money printing outlasts the necessary leverage unwind or the mayhem of an unbalanced financial system overwhelms the determined central bankers. And if we try to contemplate what happens in the next stage where the central banks figure out how to undo their balance sheet bulges, the only sure thing is that market uncertainty is going to last for years to come.
Signals from Noise – Follow Price
So let’s stay on task and circle back to our market classification. How are we going to best create our own market forecast amidst such turbulence? In the end, price is the impartial messenger. Without committing to the idea that markets are perfectly efficient, we can assume that over longer timeframes (weeks, months, years), broad index prices reflect collective information and that is enough to guide our unbiased calculations. We’ll leave discourse on short term disruptions and inefficiencies for another day.
Renko Charts – Trend is Up
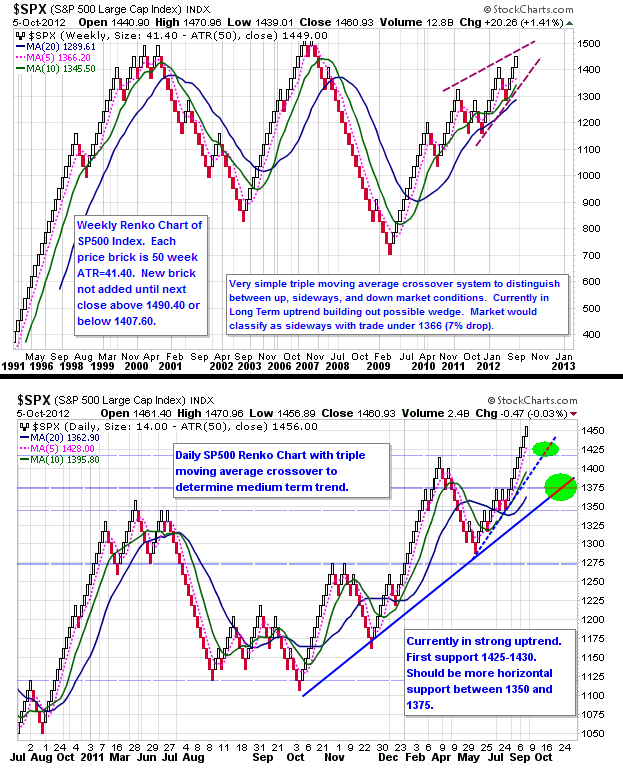
We can cut through the fog and noise with some simple S&P500 index Renko style charts which focus solely on price (Renko charts are similar to point and figure charts where new boxes are drawn only after price crosses certain thresholds regardless of the time elapsed — one box to continue, two to reverse). Add in a triple moving average system to help quantify the trends and then mark them up with a few hand-drawn trendlines to complete the picture. Here are charts covering the long and medium timeframes both in solid uptrends.
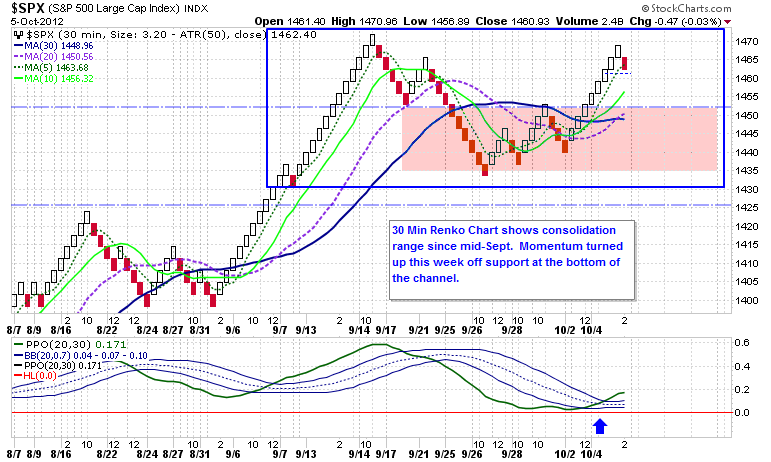
It isn’t until we zoom all the way down to 30 minute or shorter Renko charts before we get a sense of the sideways market that potentially reflects the recent selling pressure and divergences described above. Watch for extension of the trend higher if price runs over highs at 1474 for an ultimate test of 1500. On the other hand, it would be worrisome if the 1450 level is given back so quickly after the recent consolidation and breakout. Double Top + Divergence = Double Trouble for the short term. However, there is interesting support stacked up at the 1425-1430 level that might hold and prevent a drop all the way back to 1375. The lesson from the last couple years is that we shouldn’t underestimate the liquidity funds waiting on the sidelines that can catch a dip and convert a correcting market into yet another up leg in no time flat.
So once again price charts and simple technical tools can guide us in spite of the din of market opinions. Your current trading plan should reflect the state of the market in medium and long term uptrends with shorter term consolidation action. Stay disciplined, do your own unbiased evaluations, and execute your strategies. Try not to get distracted by the divergent impassioned views expressed around us.
———————————————————
Twitter: @BBTompkins and @seeitmarket Facebook: See It Market
Position in SPX e-mini futures at the time of publication.
Any opinions expressed herein are solely those of the author, and do not in any way represent the views or opinions of any other person or entity.

