The following is a recap of the May 20 COT Report (Commitment Of Traders) released by the CFTC (Commodity Futures Trading Commission) looking at COT data and futures positions of non-commercial holdings as of May 17. Note that the change in COT report data is week-over-week. This blog post originally appeared on Hedgopia – Paban’s blog.
May 20 COT Report Data – Insights And Analysis Into The Commitment Of Traders Report
COMMODITIES
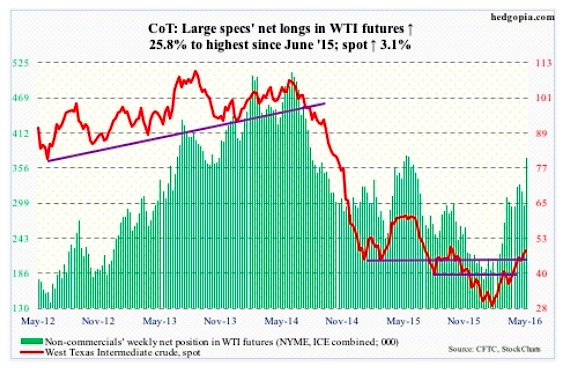
Crude Oil: The weekly EIA report was mixed to slightly better.
For the week ended May 13th, crude oil stocks rose 1.3 million barrels to 541.3 million barrels, less than four million barrels from the all-time high 545.2 million barrels in October 1929. Plus, crude oil imports increased 22,000 barrels per day to 7.7 million b/d – a four-week high.
On the positive side, refinery utilization rose 1.4 percentage points to 90.5 percent – a six-week high.
Crude oil production continued to slide, this time by 11,000 b/d to 8.8 mb/d. This was the sixth straight sub-nine mb/d. Production peaked at 9.61 mb/d in the June 5th week last year.
And stocks of both gasoline and distillates fell – the former by 2.5 million barrels to 238.1 million barrels and the latter by 3.2 million barrels to 152.2 million barrels.
Spot West Texas Intermediate crude oil prices continued to rally – up another 2.9 percent for the week, and its sixth positive week in the past seven. Momentum, no matter how overbought, is intact, with shorter-term moving averages pointing up. Ditto with the 50-day, with the 200-day flat to slightly rising. That said, some signs of potential weakness are showing up on a daily chart.
May 20 COT Report Data: Currently net long 371.2k, up 76.2k.
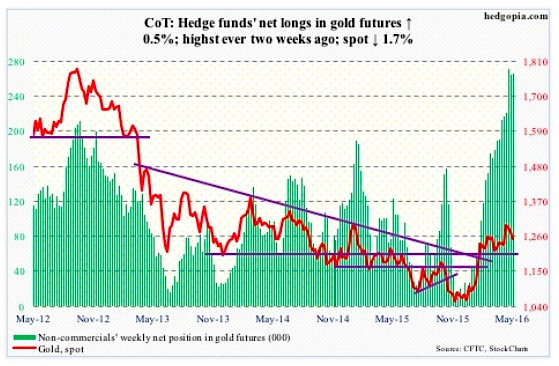
Gold: No breakout just yet. Gold prices continue to trade range-bound. Its run past 1,300/ounce in late April-early May proved fleeting.
As spot gold prices have gone sideways the past three-plus months, the 50-day moving average has now gone flat to slightly declining.
During all this, non-commercials took net longs in gold futures from 98,428 contracts on February 9th to 271,648 contracts on May 3rd. The longer gold fails to convincingly break out of the range it is in, the more the pressure these traders come under to reduce holdings. Thus far, they have shown patience.
May 20 COT Report Data: Currently net long 266.3k, up 1.4k.
EQUITIES
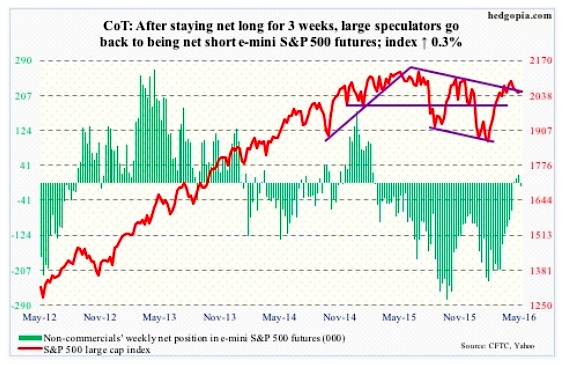
E-mini S&P 500: On Thursday, the S&P 500 at one point lost 2040 support before clawing its way back to close the session right on it. Intra-day, this large cap stock market index dropped all the way to 2025.91, which was less than 15 points from the 200-day moving average. Does this qualify for a test of that average?
If the answer is yes, then the head-and-shoulders formation that has developed on the index probably does not complete – for now. Indeed, it rallied 0.6 percent on Friday.
That said, medium-term risks remain, as overbought conditions for stocks are still being unwound.
This is particularly so as outflows have accelerated. Another $3.9 billion came out of U.S.-based equity funds in the week ended Wednesday (courtesy of Lipper). North of $21 billion has left these funds in the past three weeks, and nearly $38 billion since the week ended February 10th.
SPY, the SPDR S&P 500 ETF, was a little different, as it attracted $944.3 million in the week ended Wednesday. But even here, since February 11th through this Wednesday, $3.1 billion has been redeemed. Lots of work still for the stock market.
May 20 COT Report Data: Currently net short 8.9k, up 28.5k.
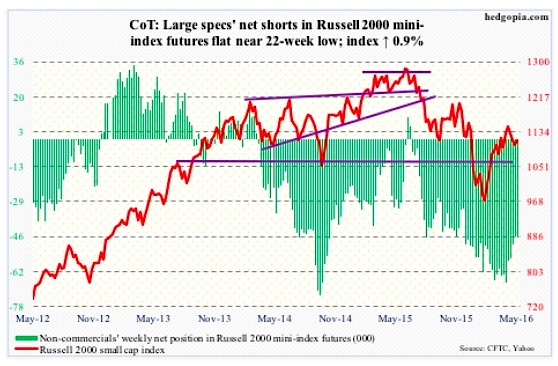
Russell 2000 mini-Index: This week’s rally attempts were denied twice by the 200-day moving average and once by the 50-day. On Friday, it rallied 1.6 percent to close right on the latter.
Fortunately for small-cap stock bulls, the index never lost 1090-1120, a support range going back to October 2013. As well, RVX, the Russell 2000 volatility index, continued to struggle to take out 21.
If flows improve, there is room to rally near term. In the week ended Wednesday, IWM, the iShares Russell 2000 ETF, lost $1.9 billion, with $1 billion redeemed on Tuesday, when the index dropped 1.7 percent.
Longer-term, the broken March 2009 trend line is intact. April’s high kissed the underside of that trend line, but was rejected. This is a negative for small cap stocks..
May 20 COT Report Data: Currently net short 45.7k, up 65.
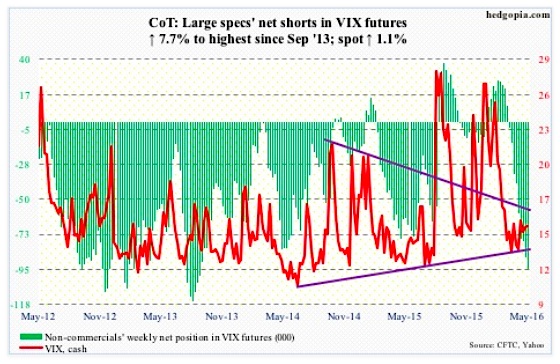
VIX Volatility Futures: Arguably, there is good news for both volatility bulls and equity bulls. For the former, the 50-day moving average is flattish to slightly falling; on Wednesday, intra-day weakness was bought near that average, which likely gets tested again next week. For the latter, resistance at 16-17 has held for the past couple of months.
Historically, once 16-17 is taken out, the spot VIX Volatility Index has shown a tendency to rally, even spike. On Thursday, the VIX jumped to 17.65 intra-day, only to give back most of the gains by close. This was the highest print since the middle of March. However, the session went on to produce a gravestone doji – potentially bearish near term. This also came right outside the upper Bollinger Band. Come Friday, VIX was handed out a 6.9-percent thumping.
May 20 COT Report Data: Currently net short 94.8k, up 6.8k.
continue reading on the next page…

