As stocks continue to march higher, some sectors are consolidating and may need a reset or pullback before the next surge.
One such sector is the Materials Sector (XLB) and it is our featured chart in today’s column.
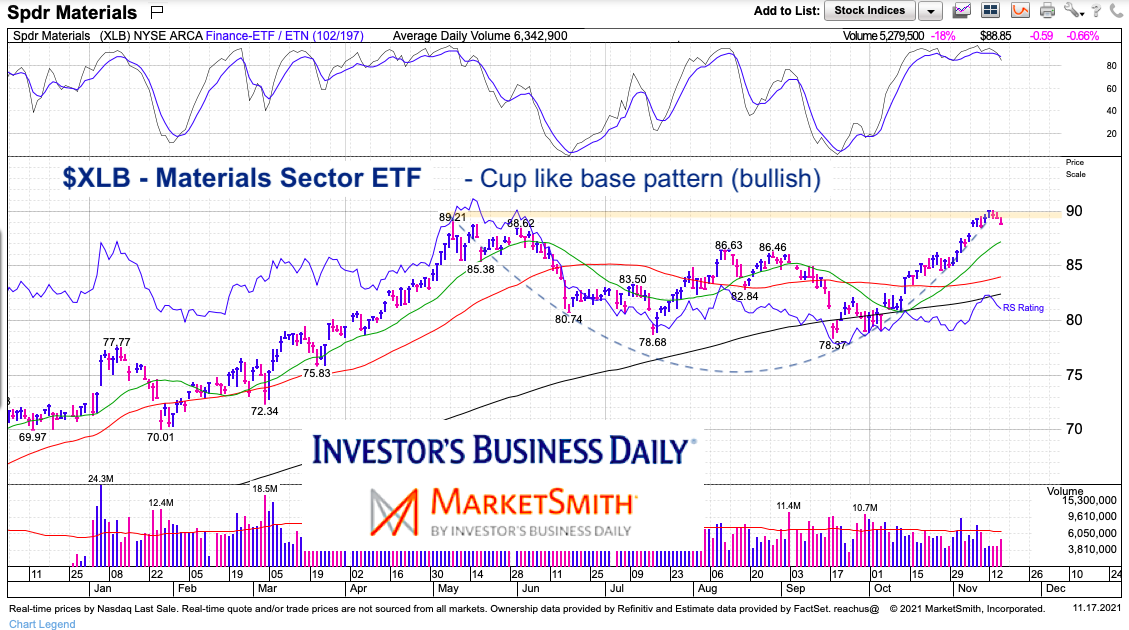
After weeks of strength, XLB has paused. And it may even need a quick refresh/reset (pullback) to re-energize. BUT the chart pattern is simple, yet noteworthy… and bullish.
Note that the following MarketSmith charts are built with Investors Business Daily’s product suite.
I am an Investors Business Daily (IBD) partner and promote the use of their products. The entire platform offers a good mix of analysts, education, and technical and fundamental data.
$XLB Materials Sector ETF Chart
After a very strong 2-month rally, XLB is pausing near its prior highs. This pause brings a bullish pattern into view: a cup like basing pattern that emerged out of a double bottom.
A pullback here would allow for a handle to form in creating a cup with handle pattern.
XLB would only turn bearish if this resistance holds for several weeks and price turns down and breaks below 50 day moving average.

Twitter: @andrewnyquist
The author may have a position in mentioned securities at the time of publication. Any opinions expressed herein are solely those of the author, and do not in any way represent the views or opinions of any other person or entity.


