 By Andrew Nyquist
I was hoping to do a more elaborate market update, but time got away from me. So I’ll have to be short and to the point here. That said, I think the annotated charts below do a nice job of speaking for themselves. As per usual, I focused on highlighting key technical levels (support and resistance) to give investors and traders ideas for managing risk.
Like 2012, the markets have gotten off to a good start in 2013. The S&P 500 and select Financial, Healthcare, Industrial, and Transportation stocks have led the way higher. But consolidation and rotation may be in play. This could also help to alleviate current overbought conditions. With this in mind, the markets may require additional backing and filling. But the good news is that the major indices are above key supports and have room to operate. See charts with technical levels and analysis below.
Trade safe, trade disciplined.
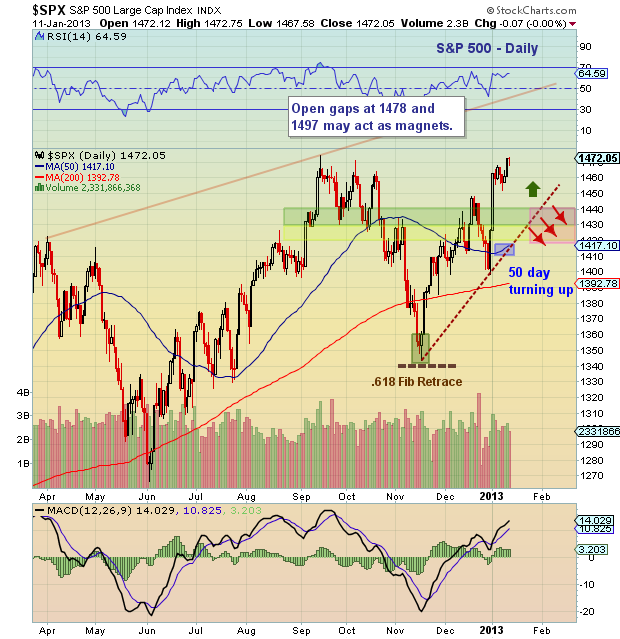
S&P 500 Daily Chart
The index has broken out of a mini flag and is threatening a move above the September highs. Two technical levels of interest are open gaps at 1478 and 1497; these could act as magnets near-term if the market follows through higher. However, if the market requires more time to consolidate gains (or decides to chop higher like this past summer), the index has room down to its uptrend line. Note that the 50 day moving average has turned higher, which is positive.
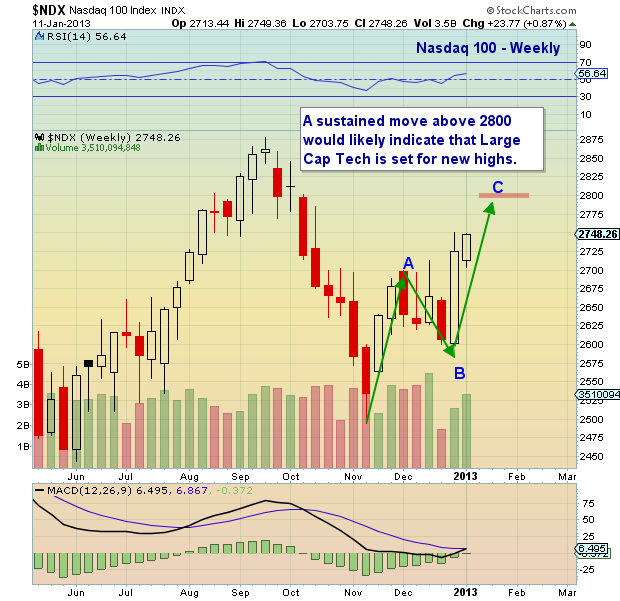
Nasdaq 100 Weekly Chart
The Nasdaq 100 is still well off its highs, thanks in large part to Apple’s (AAPL) underperformance. I am focusing on 2800 as an important level of interest near-term for the index. The technical level represents a measured A-B-C move higher and also sits in and around the .764 retracement level. A move above 2800 would be bullish.
Twitter: @andrewnyquist and @seeitmarket
No position in any of the securities mentioned at the time of publication.


