S&P 500 Futures: (2-3 Days) – Bullish
No real clues from Thursday’s unchanged close, but a few days of sideways consolidation on the S&P 500 (INDEXSP:.INX) after this recent run would likely be healthy and bullish.
This may lead to a move back higher to new all-time highs. Any drawdown likely doesn’t get below 2368 before moving back to new all-time highs. Minor reversal day which doesn’t get much traction doesn’t change the picture all that much.
TECHNICAL THOUGHTS
Final trading day in April.. Thursday proved to be a non-event with neither gains, or pullbacks getting much traction. ECB left rates unchanged as expected, though Draghi’s overly dovish talk kept the Euro lower despite recent robust economic news out of Europe. We saw further capitulation out of Energy, while Tech, Industrials and Discretionary continued to act very well.
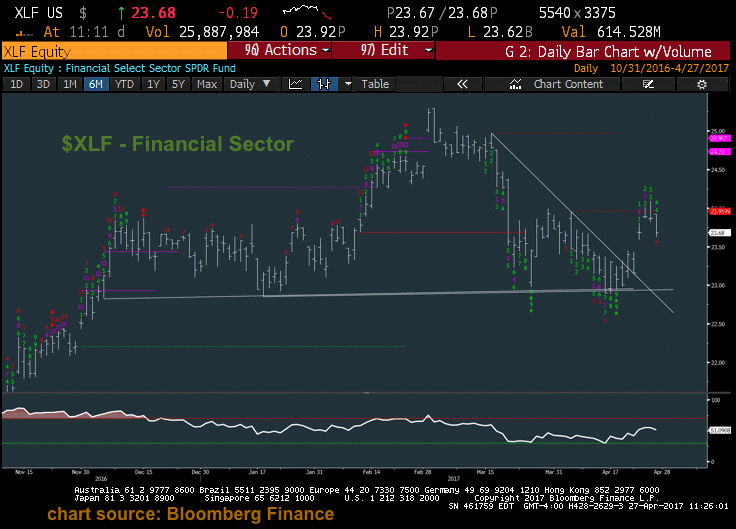
Treasury yields meanwhile backed off which proved to be detrimental for Financials, which dropped to new multi-day lows after their recent surge in the last couple weeks. Overall, not much has changed with the near-term picture based on Thursday’s non-action. IF anything, a few days of sideways trading should lead back to new highs into next week.
Pullbacks should be held near 2368.
Key to note: Eurozone now looks to be making at least a short-term peak vs US in relative terms. This was suggested as a possible buy idea a few weeks ago given the relative breakout, but the outperformance has been dramatic, with 4-5% gains following the French election for most of Europe, while the US stalled out near March highs (S&P) Counter-trend sells are now apparent on relative charts of EZU v SPX and should result in at least a bit of backing and filling at a time when sentiment on the Eurozone has grown very bullish in recent weeks.
Commodity wise- Crude now looks to be down to serious make-or-break support to buy after its recent capitulation. While Energy stocks have been far weaker and OIH itself looks to require potentially another 3-5 days of weakness before bottoming, XOP, the E&Ps look to be near support and Crude itself is near former lows. Counter-trend TD Buy Setups are now present for Crude as of Thursday’s close, bolstering the case for aggressive traders to consider a bullish stance on Crude in the short run.
XLF Financial Sector Chart
This daily chart of the Financial Sector (NYSEARCA:XLF) chart shows the rolling over in XLF after yields started to turn down in Thursday’s trading. ideally, Financials will simply fill the recent gap from earlier in the week before turning back higher, as yields still look somewhat bullish based on the momentum shift in the last couple weeks. However, a break of $22.85-.90 would have serious and bearish implications and has to be watched carefully, given the chart formation currently present.
Thanks for reading.
Get more of my ideas and daily trading insights over at Newton Advisor. Thanks for reading and good luck out there!
Twitter: @MarkNewtonCMT
Any opinions expressed herein are solely those of the author, and do not in any way represent the views or opinions of any other person or entity.


