Investors are turning their focus to second-quarter earnings reports that will continue to flow this week.
They will soon find out if a strong two weeks of gains may have priced in another solid quarter of earnings.
Stock prices improved for the second week in a row as the strength of the U.S. economy has overridden the negative implications of trade tariffs. The S&P 500 (NYSEARCA:SPY) rose 1.5% while the Dow Jones Industrials (NYSEARCA:DIA) was up 2.3%.
Entering 2018, the consensus view was that profits would peak near mid-year.
Expectations, however, have turned more positive heading into second-quarter earnings season.
Strength of the U.S. economy, easier regulatory environment, corporate tax cuts, and record buybacks have raised expectations for second-quarter profit growth to exceed 21%.
This is seen as a two-edged sword as improving profits help valuations. Yet excessive optimism on corporate earnings raises the risk that strong second-quarter results are already being reflected in current prices. Ned Davis Research shows that historically when profit growth is unusually strong, the stock market has struggled longer term.
Conversely, when earnings growth has been below 3.2%, stocks have done significantly better as the market looks ahead to improvement in earnings. The equity markets have also benefited from the fact that longer-dated Treasury yields remain below the widely followed 3.00% level. Although stocks could be vulnerable to a pullback or correction as the mid-term elections come into view, the fact that rates on the long-end have stabilized should limit potential drawdowns in the seasonally weak period of August and September.
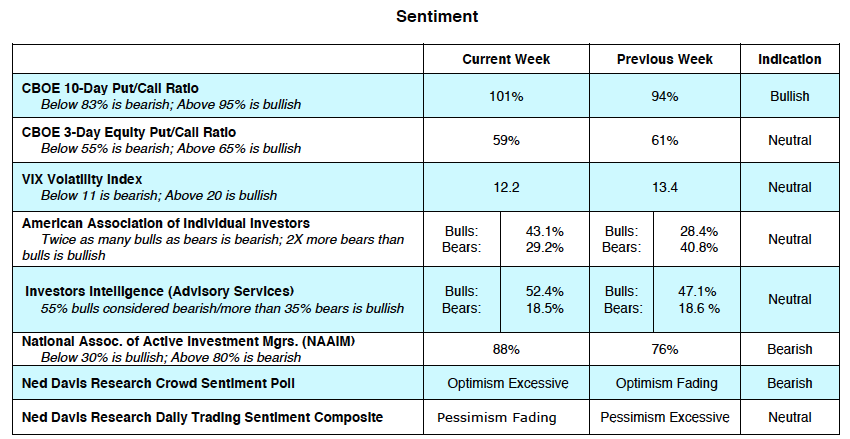
The technical underpinnings for the stock market indicate the likelihood of a continuation of a trading range environment. Investor sentiment indicators have been on a roller coaster this year. Investor optimism moved from excessive optimism in January to excessive pessimism in March.
In recent weeks on-again-off-again worry over tariffs and the potential for trade wars has caused sentiment to shift quickly. This is seen in the various surveys of investor psychology that show the bullish camps expanding last week as investors shifted their focus from trade wars to second-quarter earnings.
The CBOE Volatility Index (VIX) shows the level of investor apprehension declining. High VIX readings indicate investors are fearful and a low reading suggest complacency. The VIX closed on Friday at 12, down from 24 in March. Using contrary opinion, the sentiment indicators argue for caution. The current rally has pulled the NASDAQ to record highs and the S&P 500 Index within striking distance of the January peak. However, many areas of the market have languished including the S&P Financials, Dow Transports and the industrial sector that is below its April peak. Additionally, the percentage of S&P 500 issues trading above their 200- and 50-day moving averages remains below earlier highs.
Twitter: @WillieDelwiche
Any opinions expressed herein are solely those of the author, and do not in any way represent the views or opinions of any other person or entity.


