Yep, Jesse Felder finally shaved his beard off. Huh? What does that have to do with the S&P 500? It means the S&P 500 Index pulled back at least 10% from the high of 2134.72. Yep, that long awaited market correction has happened (is happening).
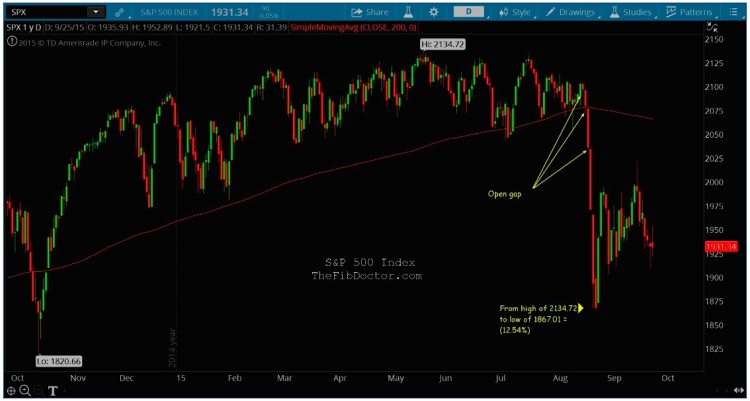
To be exact, the long awaited stock market correction is shown in the chart below to be (12.54%). That drop happened quickly and felt pretty scary. But it is also important to note that a 12.5 percent decline is a pretty standard market pullback.
The only way we’ll know if it is going to get worse or better from here is to follow key price support levels.
Below is a 1 year chart. The recent lows are are likely an area of focus for both the bulls and the bears. I’ve also highlighted 3 open body gaps above current price.
S&P 500 Index – 1 year, daily chart
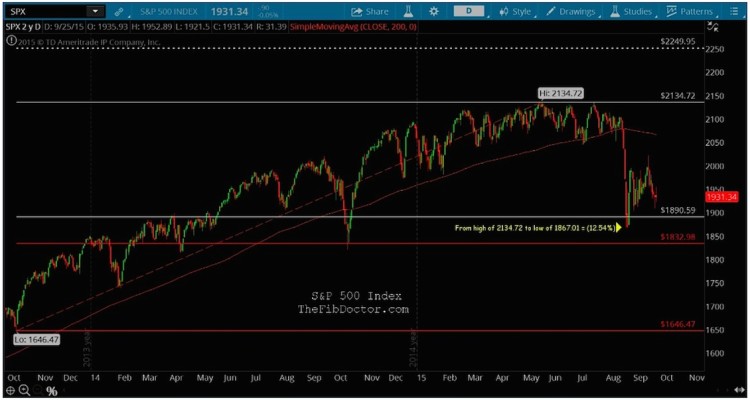
Using my Fibonacci method on a longer time frame, we can identify 2 support levels at 1890.59 and 1832.98. This also gives us an upside target of 2249.95 on the S&P 500.
In the chart below, you’ll see that the market correction of (12.54%) lands basically dead center of the 2 support levels. It’s worth noting the first support level has been tested and held on 3 occasions. The latter support (1832.98) is a must-hold.
S&P 500 Index – 2 year, daily chart
Currently, an “h” pattern is forming which can, but not always, indicate more downside. Going forward, you’ll want to watch for support at 1921.24, 1892.23, 1890.59, 1867.01, and lastly 1832.98. A close below 1832.98 would indicate appreciable weakness.
Thanks for reading and always use a stop!
Twitter: @TheFibDoctor
No position in any of the mentioned securities at the time of publication. Any opinions expressed herein are solely those of the author, and do not in any way represent the views or opinions of any other person or entity.


