The last thing an investor in a bull market wants to do is step away from a rally based on bearish divergences. At the same time, we need tools to track market breadth to determine when major trend changes are upon us. The NYSE advance – decline line is a fantastic measure, but we need more tools in our toolbox. Especially when we’re faced with a market as choppy as the current one.
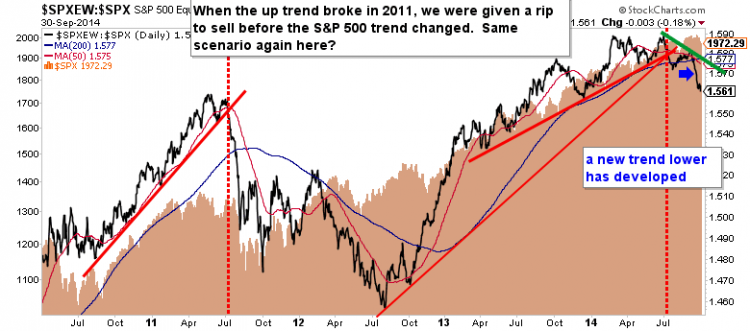
One measure that I use to track market breadth is the ratio of the S&P 500 Equal Weight Index relative to the S&P 500.
In case you’re not familiar, when the equal weight indices outperform their capitalization weight counter parts, it signals strength in the smaller names and broad market participation. When they underperform, the capitalization weighted indices can hide market deterioration.
The question is how much information can be obtained by this ratio. If you split the S&P 500 in half, the lower half only makes up roughly 15% of the total market cap. At the same time the upper half accounts for nearly 85%! Also, the market cap of smallest 450 stocks roughly equates to that of the largest 50! In this instance, a lot of information is left out!
Digging into the chart of the ratio over the past 4 years, we see clear trends have developed. For whatever reason, the uptrends have given clearer information. When an uptrend ends, it appears deterioration has reached a meaningful turning point.
After breaking the recent uptrend in August, a new trend lower has developed in the ratio. The S&P 500 is standing on a shakier foundation. Of course this certainly doesn’t mean we can’t reach new highs, but it’s something to be aware of.
Thanks for reading. And trade ‘em well!
No position in any of the mentioned securities at the time of publication. Any opinions expressed herein are solely those of the author, and do not in any way represent the views or opinions of any other person or entity.


