Another Piece Of Long-Term Evidence
In recent months, several pieces of longer-term bullish evidence have surfaced, including a rare S&P 500 signal that has only occurred ten other times in the last 35 years, a clear and factual message about stocks, a reliable contrarian indicator, weekly charts (1982-2016) painting a bullish picture, and a rare reading from a trend-strength indicator.
Signals Assist With Probabilities
No indicator, signal, or piece of evidence can predict a highly uncertain future; they simply provide some insight into the probability of good things happening relative to the probability of bad things happening, which implies bad things are always on the list of possible market outcomes.
Rare Secular Stock Market Signal
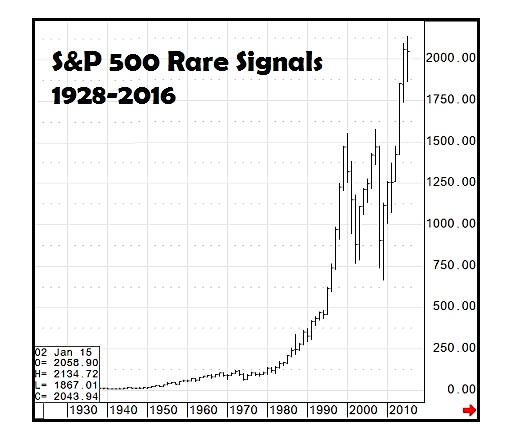
This week’s stock market video focuses on a very rare S&P 500 signal that has only occurred one other time since 1928.
Weekly Stock Market Video
Small Sample Size
It should be noted the video above covers events with a very small sample size, meaning relying on this evidence in isolation is probably not wise. Therefore, our focus, as always, is on the weight of the evidence.
No Forecasting
Our purpose is not to forecast, but rather to understand the facts we have in hand. If the facts change in a bearish manner, which may very well be the case, flexibility will prove to be valuable. It should be noted the first link in this article goes to evidence that was presented on August 20; since then, despite many dire forecasts on Wall Street, the S&P 500 has gained over 4%.
Thanks for reading.
This blog originally appeared over on CCM.
Twitter: @CiovaccoCapital
The author or his clients may hold positions in mentioned securities at the time of publication. Any opinions expressed herein are solely those of the author, and do not in any way represent the views or opinions of any other person or entity.


