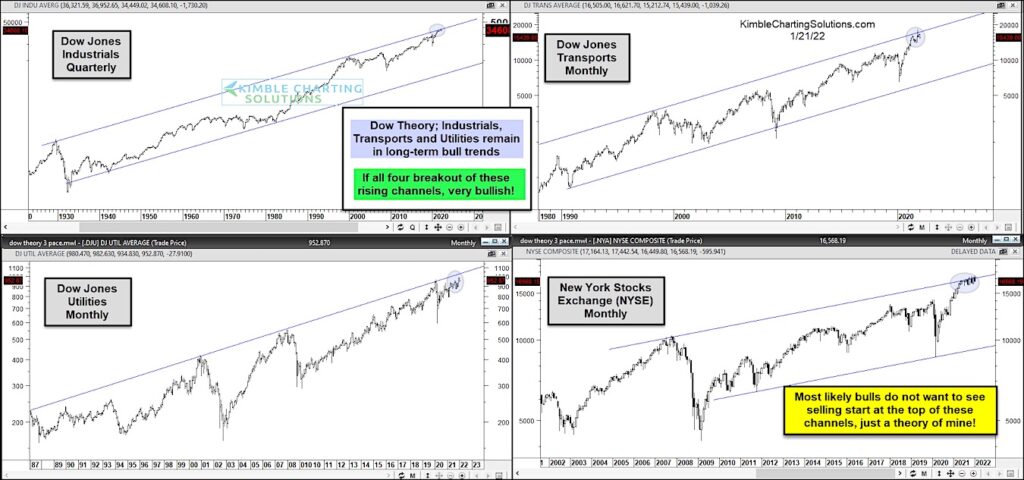
Today’s chart 4-pack illustrates why the broader stock market has reached a critical juncture this month.
Investors are feeling the heat from recent selling. Why?
Well, as the “monthly” charts above show, the Dow Industrials, Dow Transports, Dow Utilities, and NYSE Composite have reached long-term overhead price resistance.
While the long-term trend is still “up”, it isn’t surprising to see some selling here. That said, bulls worries will go from a correction to a bear market if selling really kicks in to end the month. Just a theory of mine!
Active investors will likely benefit from both caution and patience in the days/weeks ahead. Stay tuned!
Note that KimbleCharting is offering a 2 week Free trial to See It Market readers. Just send me an email to services@kimblechartingsolutions.com for details to get set up.
Twitter: @KimbleCharting
Any opinions expressed herein are solely those of the author, and do not in any way represent the views or opinions of any other person or entity.


