Macy’s (M) traded 9% higher on Wednesday morning, after reporting earnings that beat Wall Street estimates.
The company reported earnings per share of $0.42 and total revenue of $5.5 billion, above analyst expectations of $0.36 and $5.4 billion. They expect earnings for FY18 to be between $3.75 – $3.95, compared to the consensus of $3.61.
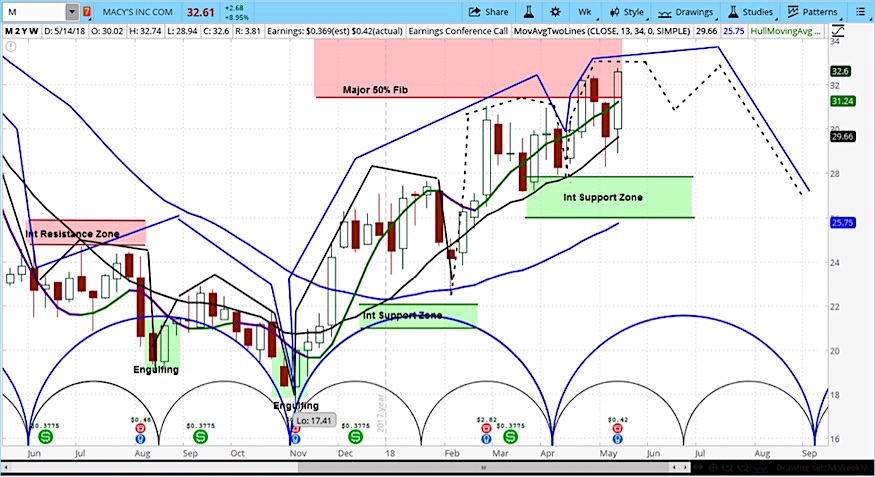
In analyzing the market cycles for Macy’s weekly chart, we can see that the stock has come a long way from its lows in November.
However, it is now moving into resistance. We expect it to be a challenge to move beyond $34.60.
Therefore, the stock may be forming a top.
For an introduction to cycle analysis, check out our video on Stock Market Cycles.
Macy’s (M) Stock Chart with Weekly Bars
Twitter: @askslim
Any opinions expressed herein are solely those of the author, and do not in any way represent the views or opinions of any other person or entity.


