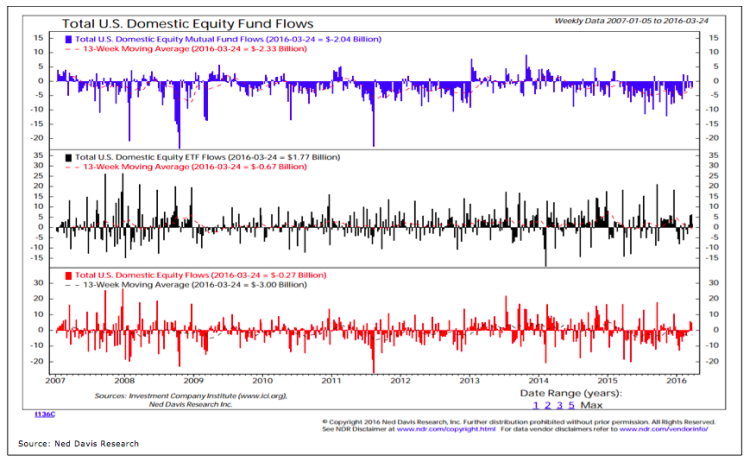
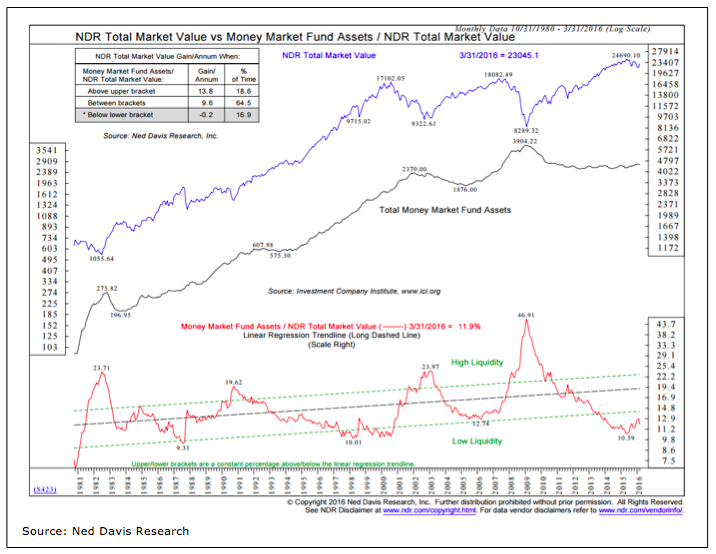
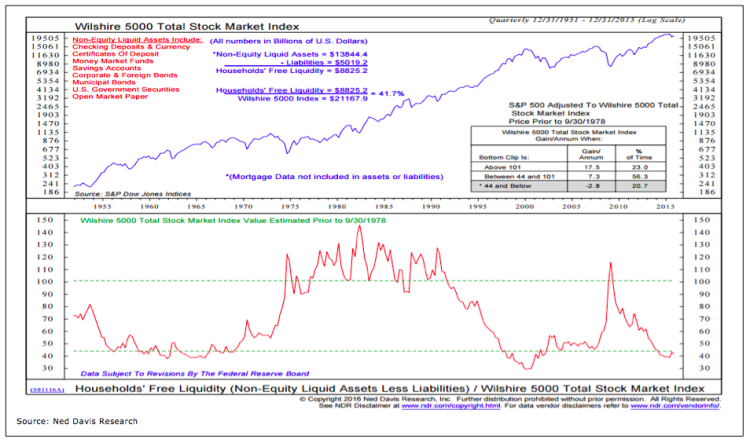
Key Takeaway: Mutual funds are seeing outflows but cash is not really building up on the sidelines. Households continue to have above-average equities exposure and, at the same time, below-average exposure to cash. Historically, forward returns for stocks have not been strong when this has been the case.
Fund flows are being closely watched right now, with outflows from equity mutual funds being seen as evidence of skepticism on the part of investors.
Domestic equity mutual funds have seen inflows in only three weeks over the past year. Focusing only on mutual fund flows distorts the picture however, as there appears to be an ongoing secular shift from mutual funds to ETFs. For example, the $2 billion outflow from domestic equity mutual funds in the week ending March 24 was almost entirely offset by inflows to domestic equity ETFs. But even looking at the combined flow data, there seems to be an ongoing rotation away from equities.
While there seems to be a rotation away from equities (which has historically been bullish for stocks), there does not appear to be a comparable rotation into cash. In fact there is little evidence of cash building on the sidelines. Money market fund assets compared to total stock market value is off its lows, but just barely, and continues to warn of low investor liquidity.
Even if the definition of “cash on the sidelines” is expanded to include almost every non-equity liquid asset (not just money market funds, but checking and savings accounts, corporate and government bonds, even currency) there is still a remarkable lack of investor liquidity. For as much talk of how unloved the stock market rally has been, investors have not been shy about drawing down cash relative to stocks.
There are several different ways to come up with a comprehensive look at household allocation levels. Data from ICI is available on a monthly basis that shows total mutual funds and ETF exposure to equities, bonds and cash.
continue reading on the next page…


