Market trends and rotation occur in both localized (domestic) and global markets. With this in mind, it’s important to understand that we have many investment choices across the globe… and within our own given markets that we tend to follow.
Additionally, many of these markets can be used as indicators that help us understand what’s happening in the marketplace.
With political uncertainty hitting the stream daily and near-term market concerns rising, it’s always good to review key asset classes and sectors. Below are 5 charts that I’m watching right now.
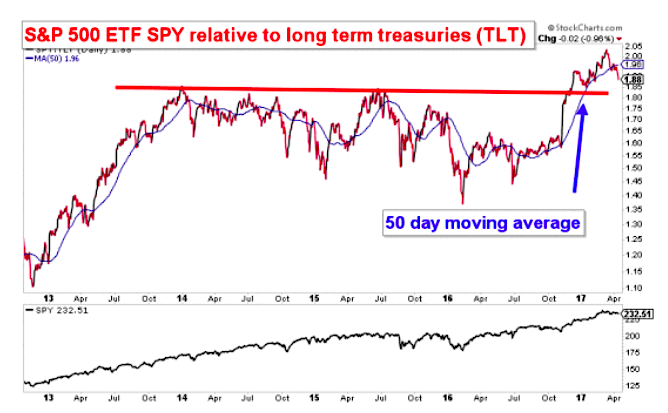
S&P 500 ETF (SPY) relative to Long Term U.S. Treasuries ETF (NASDAQ:TLT)
This ratio has rolled over below the 50 day moving average, but remains over old resistance. This will be a key ratio to watch throughout Q2 and into Q3.
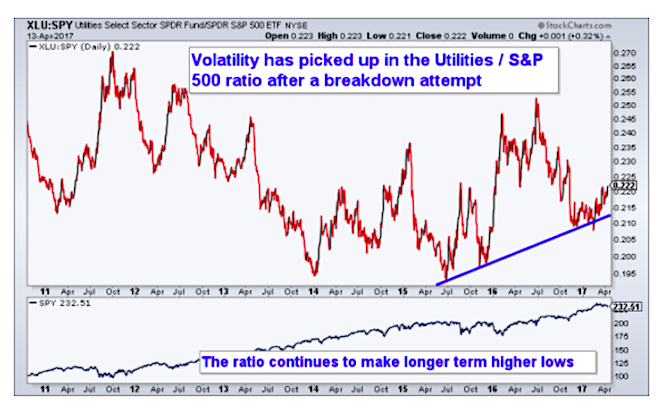
Utilities ETF (NYSEARCA:XLU) relative to S&P 500 ETF (NYSEARCA:SPY)
This ratio continues to make new long term higher lows.
This could mean a few things including: rates are going to stay low for the foreseeable future, the equity market actually is in the later stages of a market rally OR these companies are simply poised to outperform via benefits from improved profitability via grid technology and improving pipeline infrastructure.
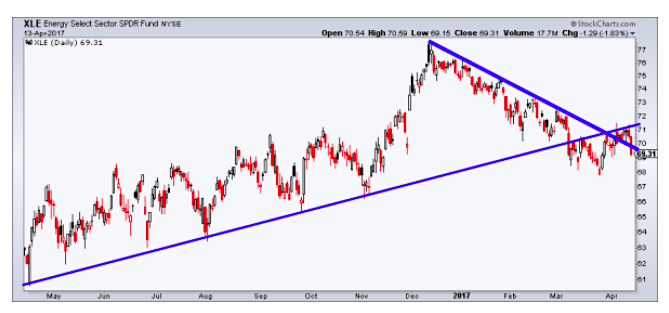
Energy ETF (NYSEARCA:XLE)
The Energy Sector (XLE) broke its downtrend from December, but it appears that move is temporary as the breakout has been lost and a former trend support line has become resistance.
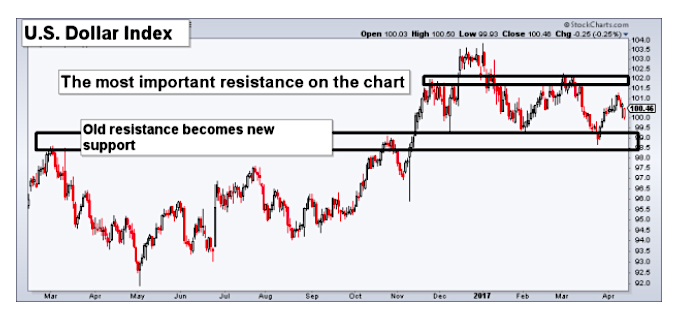
The U.S. Dollar Index
The buck remains rangebound. It’s currently stuck between the 99 and 102 levels. The range breakout will have a major impact on markets, whenever that occurs.
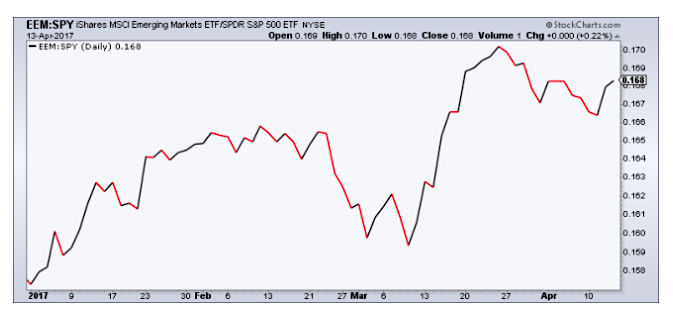
Emerging Markets ETF (NYSEARCA:EEM) relative to the S&P 500 ETF (SPY)
Thus far in 2017, the drift lower in the Dollar has helped non-US stocks outperform.
Catch more of my analysis over at North Star TA. Thanks for reading.
Twitter: @ATMcharts
Any opinions expressed herein are solely those of the author and do not in any way represent the views or opinions of any other person or entity.

