The supply chain has dealt with several issues over the past couple of years, as consumers and businesses have been forced to navigate a tricky “COVID” landscape.
Commodity prices (in general) have risen, while enduring some big swings.
Today we look at a commodity that plays an intricate role for consumers, and perhaps the equities market as well. Lumber. When lumber prices are high, new homes and buildings cost quite a bit more.
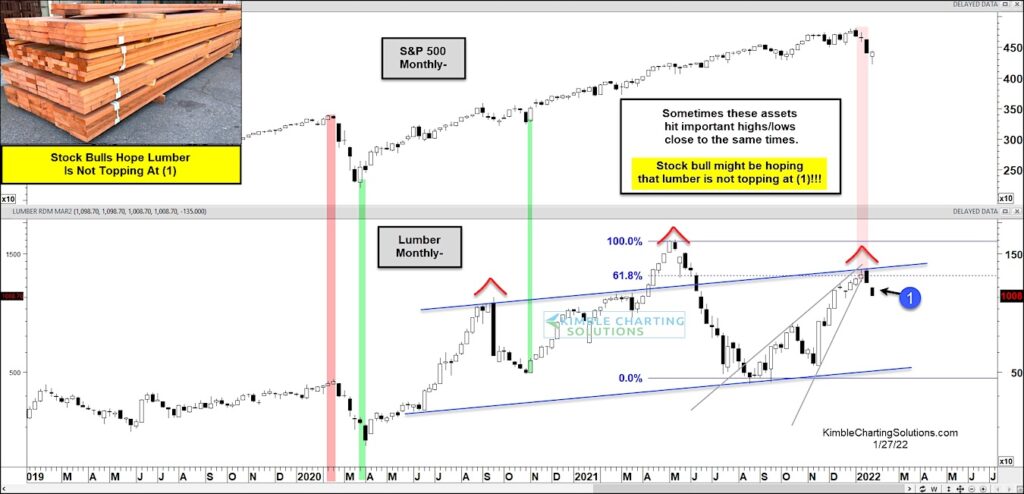
Below is a “weekly” chart of lumber prices. As you can see, there have been times when a lumber peak/bottom have been important for equities (S&P 500 Index). Lumber prices have recently rallied back to the 61.8 Fibonacci retracement of the past years high-low at (1) and appear to be turning back down.
Stock bulls might be hoping that lumber is not topping at (1)! Stay tuned!!
S&P 500 versus Lumber Prices “weekly” Chart

Note that KimbleCharting is offering a 2 week Free trial to See It Market readers. Just send me an email to services@kimblechartingsolutions.com for details to get set up.
Twitter: @KimbleCharting
Any opinions expressed herein are solely those of the author, and do not in any way represent the views or opinions of any other person or entity.


