At a recent investment conference, hedge fund billionaire Stanley Druckenmiller predicted that interest rates would continue rising. Specifically, he suggested that, consistent with the prospects for economic growth, the 10-year U.S. Treasury yield could reach 6.00% over the next couple of years. Druckenmiller’s track record lends credence to his economic perspectives.
While we would very much like to share his optimism, we find it difficult given the record levels of public and private debt.
Druckenmiller’s comments appear to be based largely on enthusiasm for the new administration’s proposals for increased infrastructure and military spending along with tax cuts and deregulation. This is consistent with the outlook of most investors today. Although proposals of this nature have stimulated economic growth in the past, today’s economic environment is dramatically different from prior periods. Investors and the market as a whole are failing to consider the importance of the confluence of the highest debt levels (outright and as a % of GDP) and the lowest interest rates (real and nominal) in the nation’s history. Because of the magnitude and extreme nature of these two factors, the economic sensitivity to interest rates is greater and more asymmetric now than it has ever been. Additionally, due the manner in which debt and interest rates have evolved over time, the amount of interest rate risk held by fixed income and equity investors poses unparalleled risks and remains, for the moment, grossly underappreciated.
Proper assessment of future investment and economic conditions must carefully consider changes in the debt load and the interest rates at which new and existing debt will be serviced.
A 45-year Trend
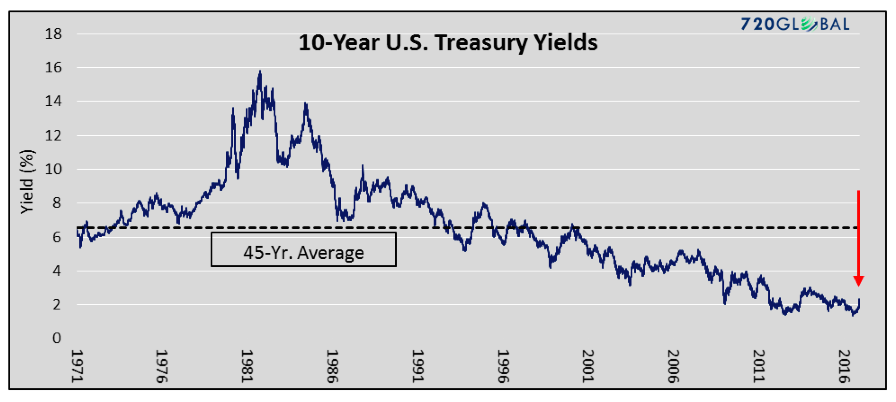
For more than a generation, there has been a dramatic change in the landscape of interest rates as illustrated in the graph below. Despite the recent rise in yields (red arrow), interest rates in the United States are still near record-low levels.
Treasury Data Courtesy of Bloomberg
Declining interest rates have been a dominant factor driving the U.S. economy since 1981. Since that time, there have been brief periods of higher interest rates, as we see today, but the predictable trend has been one of progressively lower highs and lower lows.
Since the Great Financial Crisis in 2008, interest rates have been further nudged lower in part by the Federal Reserve’s (Fed) engagement in a zero-interest rate policy, quantitative easing and other schemes. Their over-arching objective has been three-fold:
- Lower interest rates to encourage more borrowing and thus more consumption (“How do you make poor people feel wealthy? You give them cheap loans.” –The Big Short)
- Lower interest rates to allow borrowers to reduce payments on existing debt thus making their balance sheet more manageable and freeing up capacity for even more borrowing
- Maintain a prolonged period of low interest rates “forcing” investors out of safe-haven assets like Treasuries and money market funds and into riskier asset classes like junk bonds and stocks with the aim of manufacturing a durable wealth effect that might eventually lift all boats
In hindsight, lower interest rates were successful in accomplishing some of these objectives and failed on others. What is getting lost in this experiment, however, is that the marginal benefits of decreasing interest rates are significantly contracting while the marginal consequences are growing rapidly.
Interest Rates and Duration
What are the implications of historically low interest rates for a prolonged period of time? What is “seen” and touted by policy makers are the marginal benefits of declining interest rates on housing, auto lending, commercial real estate and corporate funding to name just a few beneficiaries. What is “unseen” are the layers of accumulating risks that are embedded in a system which discourages savings and therefore eschews productivity growth. Companies that should be forced into bankruptcy or reorganization remain viable, and thus drain valuable economic resources from other productive uses of capital. In other words, capital is being misallocated on a vast scale and Ponzi finance is flourishing.
In an eerie parallel to the years leading up to the crisis of 2008, hundreds of billions of dollars of investors’ capital is being jack-hammered into high-risk, fixed-income bonds and dividend-paying stocks in a desperate search for additional yield. The prices paid for these investments are at unprecedented valuations and razor thin yields, resulting in a tiny margin of safety. The combination of high valuations and low coupon payments leave investors highly vulnerable. Because of the many layers of risk across global asset markets that depend upon the valuations observed in the U.S. Treasury markets, deeper analysis is certainly a worthy cause.
At the most basic level, it is important to appreciate how bond prices change as interest rates rise and fall. The technical term for this is duration. Since that price/interest rate relationship is the primary determinant of a bond’s profit and loss, this analysis will begin to reveal the potential risk bond investors face. Duration is defined as the sensitivity of a bond’s price to changes in interest rates. For example, a 10-year U.S. Treasury note priced at par with a 6.50% coupon (the long term average coupon on U.S. Treasury 10-year notes) has a duration of 7.50. In other words, if interest rates rise by 1.00%, the price of that bond would decline approximately 7.50%. An investor who purchased $100,000 of that bond at par and subsequently saw rates rise from 6.50% to 7.50%, would own a bond worth approximately $92,500.
By comparison, the 10-year Treasury note auctioned in August 2016 has a coupon of 1.50% and a duration of 9.30. Due to the lower semi-annual coupon payments compared to the 6.50% Treasury note, its duration, which also is a measure of the timing of a bonds cash flows, is higher. Consequently, a 1.00% rise in interest rates would cause the price of that bond to drop by approximately 9.30%. The investor who bought $100,000 of this bond at par would lose $9,300 as the bond would now have a price of $90.70 and a value of $90,700.
A second matter of importance is that the coupon payments, to varying degrees, mitigate the losses described above. In the first example, the annual coupon payments of $6,500 (6.50% times the $100,000 investment) soften the blow of the $7,500 loss covering 86% of the drop in price. In the second example, the annual coupon payments of $1,500 are a much smaller fraction (16%) of the $9,300 price change caused by the same 1.00% rise in rates and therefore provide much less cushion against price declines.
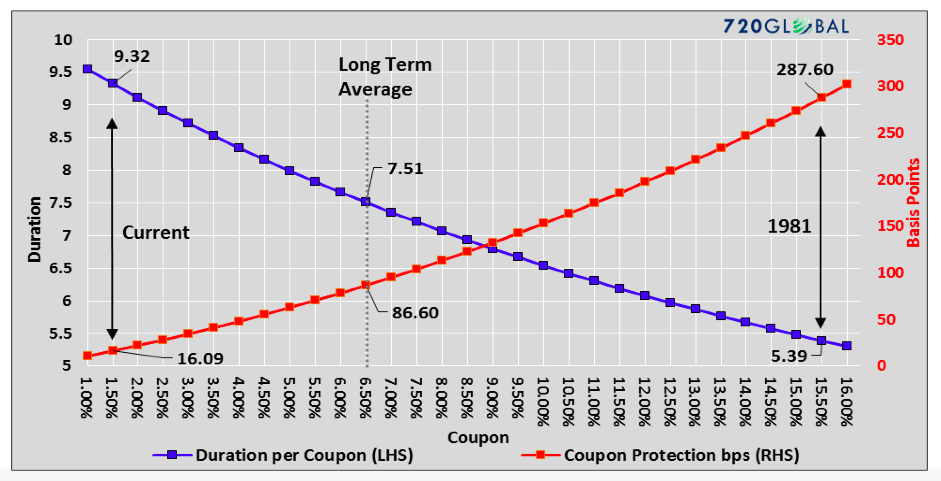
In the following graph, the changing sensitivity of price to interest rate (duration- blue) is highlighted and compared to the amount of coupon cushion (red), or the amount that yield can change over the course of a year before a bondholder incurs a loss.
The coupon on the 10-year U.S. Treasury note used in our example only allows for a 16 basis point (0.16%) increase in interest rates, over the course of a year, before the bondholder posts a total return loss. In 1981, the bondholder could withstand a 287 basis point (2.87%) increase in interest rates before a loss was incurred.
Debt Outstanding
While the increasing interest rate risk and price sensitivity coupled with a decreasing margin of safety (lower coupon payments) of outstanding debt is alarming, the story is incomplete. To fully appreciate the magnitude of this issue, one must overlay those risks with the amount of debt outstanding.
continue reading on the next page…


