Often, it pays to sit atop the fray and take the long view.
Even if it means doing so with protective and reflective gear on.
We noted over the weekend that the S&P 500 (SPY) touched down yet held the 50-day moving average, and the Semiconductors Sector ETF (SMH) landed right on a weekly exponential moving average.
Therefore, as surprising as the rally in equities was today, the bulls have been trained to buy on these key price support levels.
The bounce seemingly ignored all the fallout we have yet to assess from the virus and its economic impact.
Today’s rally in the major stock market indices and many of the key sector ETFs spawned an inside day.

Furthermore, all the indices and sectors that went into unconfirmed caution phases (SMH, IBB, IWM, KRE, DIA, XRT) stayed there.
The Transportation Sector ETF (IYT), did at least manage to hold the 200-DMA, so there’s that.
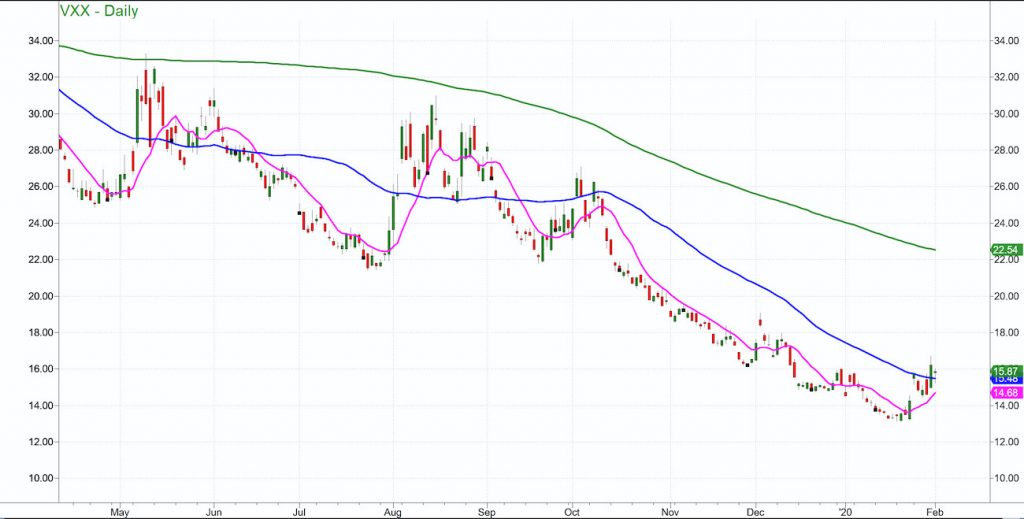
However, with the Volatility Index ETF (VXX) now above its 50-Daily Moving Average and confirmed in a recuperation phase, whether today’s bounce sustains, remains to be seen.

The Daily chart shows three moving averages.
The green above is the 200-DMA, the blue the 50-DMA and the magenta the 10-DMA.
On January 24, VXX cleared the 10 DMA with 3 times the daily average volume.
Last Friday, VXX cleared the 50-DMA with also close to 3 times the daily average volume.
The seasonal calendar range high is 15.73, now pivotal.
Additionally, VXX had an inside day and confirmed the recuperation phase.
Now, VXX has had pockets of strength last year. Most notably, August 1, VXX had the most volume in well over a year and rallied $10.00 in less than 2 weeks.
VXX is a great instrument to trade for catching market reversals, but the nature of the instrument can leave swing traders from the long side, poorer.
If I have learned anything from the last four years and the market’s phantasmic irrationality, it’s that deep pockets, mainly from corporate buybacks has helped this market ignore all potentially bad news.
So, watch VXX and also watch how today’s inside day resolves, particularly in the market leaders, Semiconductors and NASDAQ 100.
On July 12-13, 2020, I will be speaking/teaching at the Modern Traders Summit in Philadelphia. Only 5 speakers, which means attendees will get a lot of attention, I hope to meet many of you there: https://moderntraderssummit.com/2020-speakers/
S&P 500 (SPY) 321 is the 50-day moving average. 324.00 pivotal and 327.17 point to clear
Russell 2000 (IWM) 160 support 162 pivotal and 164.13 point to clear.
Dow Jones Industrials (DIA) 284.62 is the 50-DMA pivotal and 287.23 point to clear.
Nasdaq (QQQ) 222.10 pivotal 223.56 point to clear.
KRE (Regional Banks) 53.90 the 200 weekly moving average and 54.00 is the 200-DMA. Price resistance at 55.85
SMH (Semiconductors) 139.97 is the 50 day moving average price resistance. 136 is key support.
IYT (Transportation) Unconfirmed caution phase as this sits right on 189.68. Resistance 193.01
IBB (Biotechnology) 111 support 117.40 resistance.
XRT (Retail) 43 support at the 200-DMA and must clear 44.23
Volatility Index (VXX) Confirmed Recuperation phase-15.47 pivotal.
Twitter: @marketminute
The author may have a position in the mentioned securities at the time of publication. Any opinions expressed herein are solely those of the author, and do not in any way represent the views or opinions of any other person or entity.


