 By Andrew Nyquist
Most conversations around the global economy and fiscal outlook revolve around two key subjects: money printing vs austerity and higher taxes/more spending vs lower taxes/less spending. Both are hot buttons and equally important to global growth. The consequences of getting policies right/wrong fuels sub-arguments surrounding inflation vs deflation and global growth slowing vs rising population.
But the important end-game to each of these arguments leads to, in my opinion, the most important byproduct of global economic policy amidst a rising population: commodity prices. Technology has increased competition and assisted in keeping prices from getting out of control (a life saver thus far); this is especially true with consumer products. But the current transition to the Technological Age has also seen rising commodity prices. Volatile, yes, but most have remained in a bull market, holding at or above longer term trend lines.
With this in mind, I thought it would be good to look at some long term charts of key agriculture commodities. As is the case with most of my chart work, I’ll look to highlight key trend lines and technical support and resistance levels. But note that the future is still very uncertain and policy decisions over the coming year will likely affect commodity prices for some time to come. This shouldn’t be news to anyone as we are operating in a highly sensitive and politicized world while trying to solve the US “fiscal cliff” and current financial imbalances. And across the pond we have the ongoing Euro zone debt crisis. That’s why identifying and following key technical and psychological levels will be important going forward.
With this in mind, let’s turn to the charts.
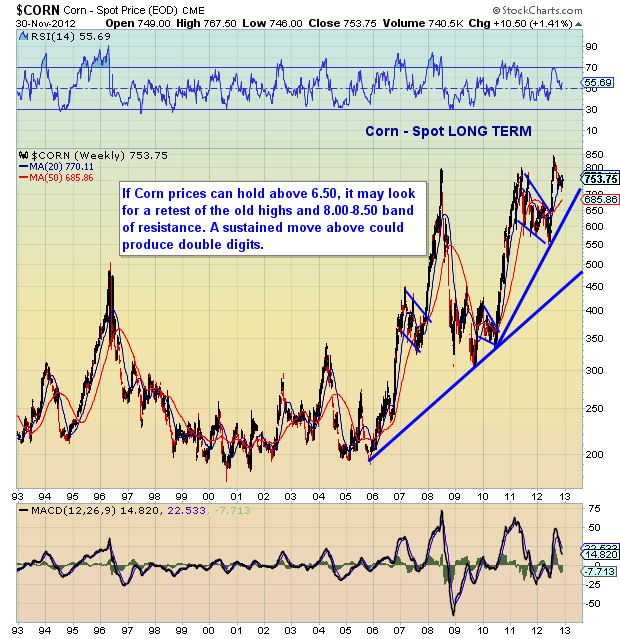
Corn Spot Price Long Term Chart:
After retracing roughly 50 percent of the 2009 low to 2011 high (at 550), Corn surged to new highs in 2012. Key intermediate support resides around 650.
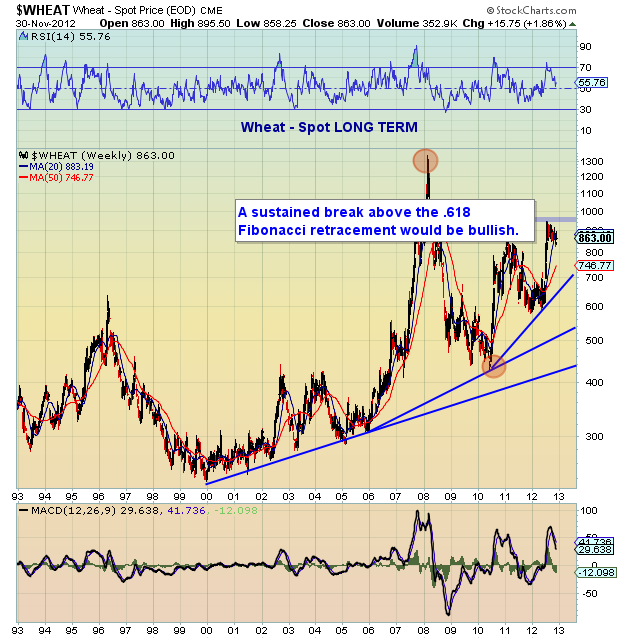
Wheat Spot Price Long Term Chart:
Wheat prices saw another run higher in 2012. However, thus far, the move has only produced a lower high. If wheat prices are going to threaten all time highs, they will need to break out above the 61.8% Fibonacci retrace level (of 2008 highs to 2010 lows).
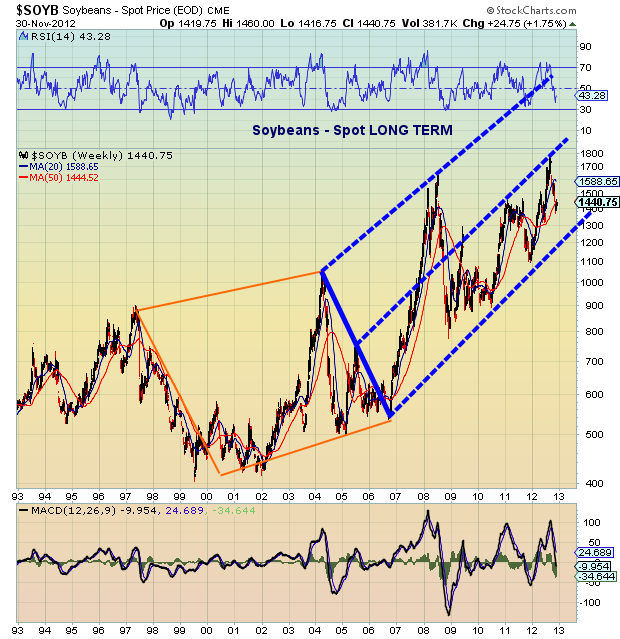
Soybeans Spot Price Long Term Chart:
Soybeans remain in a bull market, contained in the lower have of the bullish channel. The lower, long term support line will be important to watch if further pricing pressure materializes.
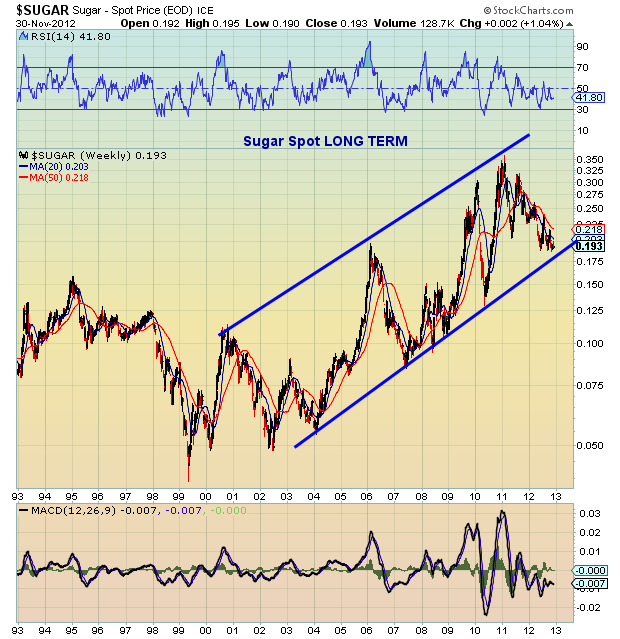
Sugar Spot Price Long Term Chart:
Sugar is caught in a wide and volatile bullish price channel. A break above the 2011-2012 downtrend line could ignite another rally in sugar prices.
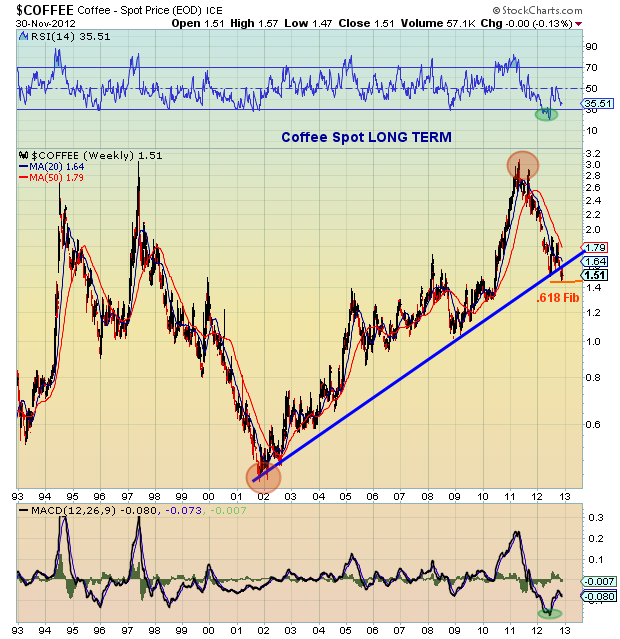
Coffee Spot Price Long Term Chart:
Coffee has been in a steep two year downtrend that recently saw prices puncture the long term trend line. That said, the recent lows were the 61.8 percent Fibonacci retracement of the 2002 to 2011 bull run. If Coffee prices are going to make another run higher, they will need to retake the long term trend line and follow through higher. A failed rally attempt would be a sign of weakness.
———————————————————
Twitter: @andrewnyquist and @seeitmarket Facebook: See It Market
No position in any of the securities mentioned at the time of publication.
Any opinions expressed herein are solely those of the author, and do not in any way represent the views or opinions of his employer or any other person or entity.

