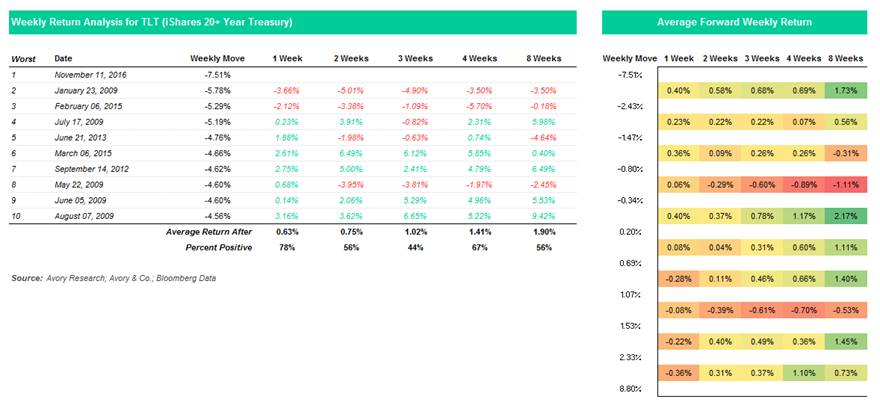
We just witnessed the worst week for long bonds in 10 years. The iShares 20+ Year Treasury ETF (NASDAQ:TLT) was down -7.33% (-7.51% intra-day) for the week ending November 11th. Looking back 10 years, the 2nd worst week for long bonds was a -5.78% drop during the week ending January 23rd, 2009. The third worst week was lower by -5.29%.
Below is the data I am referring to. There are a couple different observations to note.
- The 2nd and 3rd worst weeks for long bonds were not met with any relief 1 to 8 weeks afterwards.
- The following week was up 78% of the time, but this falls to a coin flip thereafter.
- The worst return 2 weeks later was -5.01%, and the best was 6.49%.
- Average return for each time period is actually positive.
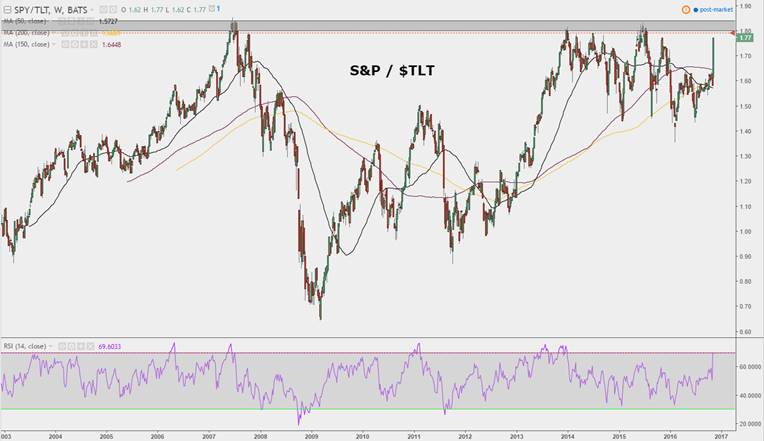
Going through charts to try and determine what to make of this, I turned to a ratio chart. This is the S&P 500 measured by the SPDR S&P 500 ETF (NYSEARCA:SPY), versus the iShares 20+ Year Treasury ETF or $TLT. The chart is striking as we are fast approaching all-time highs in the pair (3% away). The bull inside of me wants this pair to break out as that would give me confidence that we may be entering a new phase of the equity bull market. However, breaking out to all-time highs after a massive run won’t be an easy task. This leads me to think that a solid risk return trade could be a long $TLT and short $SPY. The beauty of it is that the stop loss is only 2-3% away, making this favorable from a risk standpoint.
I think this is interesting to watch as it relates to the overall bull market, as a potential opportunity, and simply wanted to share that with you.
Note that I am not currently in the trade and this is NOT a recommendation for that purpose. Thanks for reading.
Twitter: @_SeanDavid
Any opinions expressed herein are solely those of the author, and do not in any way represent the views or opinions of any other person or entity.


