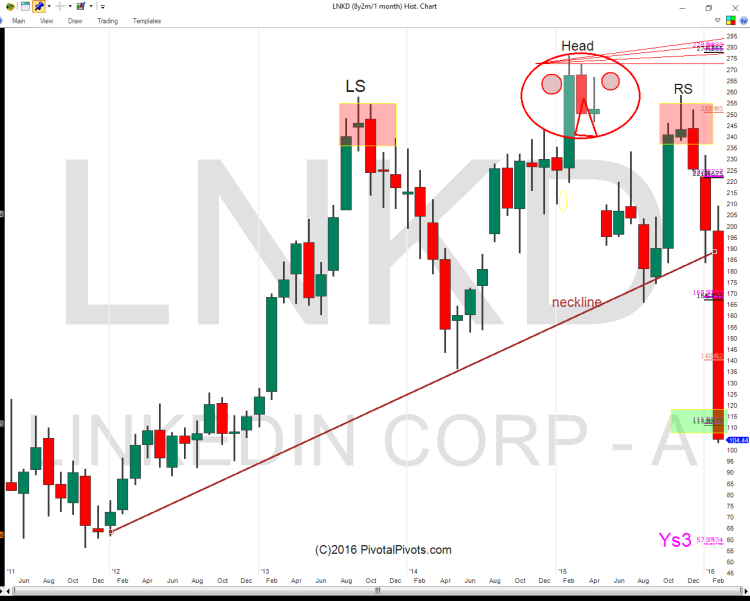
LinkedIn Corp (LNKD) has made a name for itself in corporate networking and has a product that many professionals use. However, investors crave growth and innovation. And it seems that one or both may be slowing based on the reaction to LinkedIn’s latest earnings report, which is also seen in the LinkedIn stock price.
But, to be fair, LinkedIn stock was giving investors some hints along the way.
For the past 3 years, $LNKD has traded sideways in a wide range. That price action also created a 3 year head and shoulder formation (a topping pattern) on the LinkedIn stock chart… and that pattern broke to the downside following their latest earnings report.
So, as you can see, we are currently in the right shoulder part of the move. So how far could the stock fall?
Well, if the stock price cannot recapture $111 (Ys2 pivot) and hold it, then the YearlyS3 pivot may come into view at $57. That’s extreme and would be a long way for this titan to fall in 2016.
LinkedIn Stock Chart – $LNKD
Be careful out there. 2016 is the “Year of the Monkey”. They like to swing from tree to tree looking for fruit. It should be a wild year!
Further reading from Jeff York: “2016 Yearly Pivots For Stock Market Indices & Commodities“
Twitter: @Pivotal_Pivots
The author does not have a position in the mentioned securities at the time of publication. Any opinions expressed herein are solely those of the author, and do not in any way represent the views or opinions of any other person or entity.


