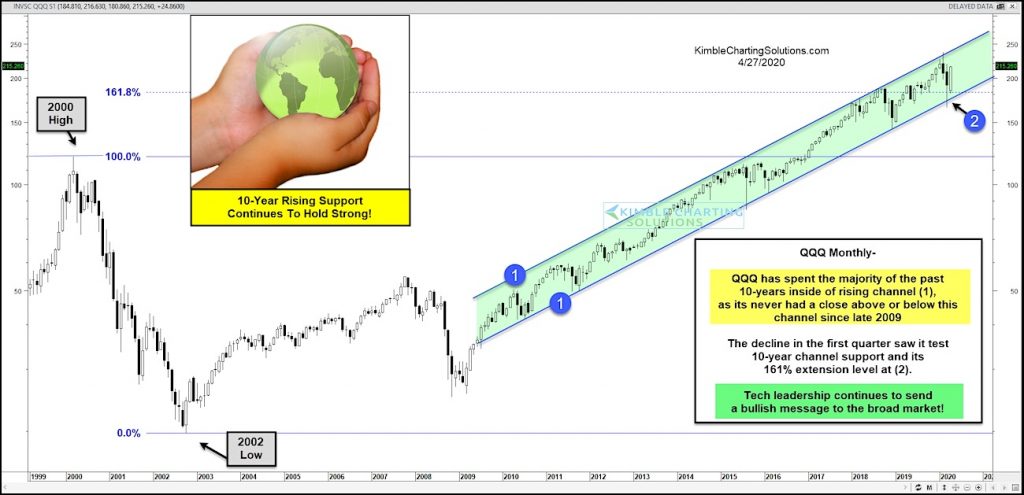
$QQQ Large Cap Technology ETF “monthly” Chart
The stock market crash was a scary event and the future still holds plenty of uncertainty.
But today’s chart provides some hope.
The Nasdaq 100 ETF (QQQ) represents large cap tech stocks, an area that has been a leader of the bull market run off the 2009 lows.
As you can see, the QQQ’s have been in a 10 year rising channel marked by each (1). And there hasn’t been a close above or below the channel.
The stock crash last month saw the QQQ’s test the 10-year rising support as well as the 161.8 Fibonacci extension level at (2). And that support held!
Leadership in the large cap tech space continues to send a bullish message to longer-term investors. Stay tuned!
Note that KimbleCharting is offering a 2 week Free trial to See It Market readers. Just send me an email to services@kimblechartingsolutions.com for details to get set up.
Twitter: @KimbleCharting
Any opinions expressed herein are solely those of the author, and do not in any way represent the views or opinions of any other person or entity.


