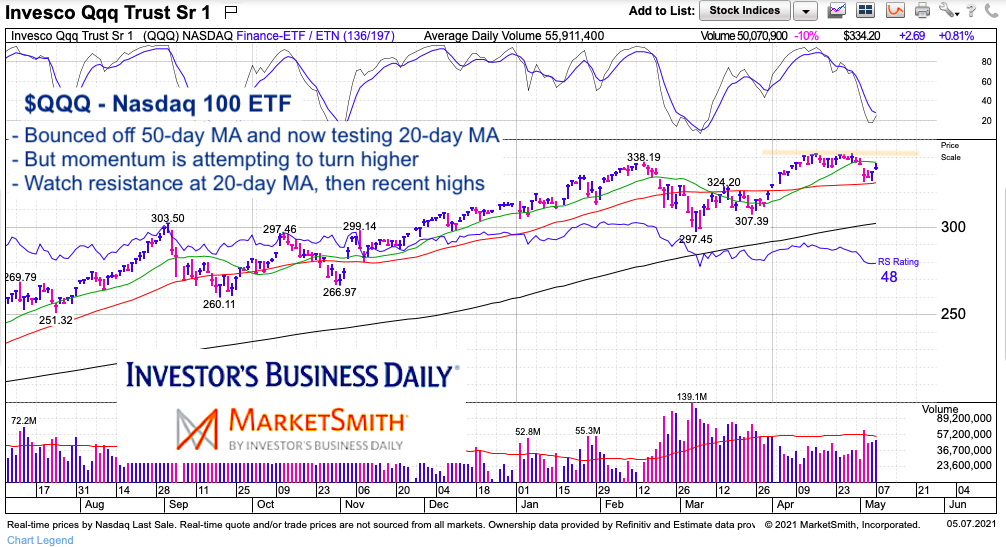
Large cap tech stocks have lost some steam in the past few weeks, with the Nasdaq 100 Index ETF (QQQ) having trouble breaking out above the $340 price level.
$338 was the February high, and although QQQ broke that high marginally in April, it was not decisive.
Now the Nasdaq 100 ETF (QQQ) is bouncing higher once more. The bounce comes off of its 50-day moving average. Is it sustainable? Let’s look at the chart.
Note that the following MarketSmith charts are built with Investors Business Daily’s product suite.
I am an Investors Business Daily (IBD) partner and promote the use of their products. The entire platform offers a good mix of technical and fundamental data and education.
$QQQ Nasdaq 100 ETF Chart
The 50-day moving average looks like important near-term support. Last week’s bounce came from that level. QQQ is now testing the underside of its 20-day moving average. This is a critical area because a break back above that level will likely send the QQQ to test its highs, and likely make new highs. However, a breakdown from here would bring the 50-day moving average into view again. And a move below that level would be bearish.
Another indicator that that we are at a key short-term time/price area is momentum – it is trying to turn higher (watch for a crossover). Note that we saw something similar in late February but momentum failed to follow-through and the pullback continued. Stay tuned.

Twitter: @andrewnyquist
The author may have a position in mentioned securities at the time of publication. Any opinions expressed herein are solely those of the author, and do not in any way represent the views or opinions of any other person or entity.


