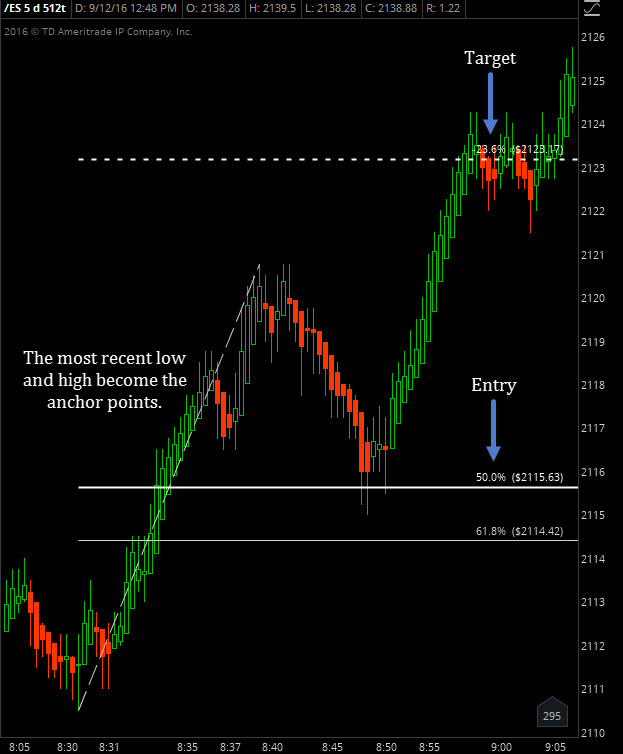
Trading Fibonacci retracements as a low risk/high reward entry is an approach that’s been around for a long long time.
At times, it can be freaky how placing a Fib retracement on a chart can be so accurate. But when we take a look at Fibonacci retracements and the golden rule in nature, it really can be found everywhere.
When it comes to trading Fibonacci retracements effectively, I prefer smaller time frames where many traders end up making decisions on their emotions. Thus the patterns end up presenting themselves day in and day out in the markets.
Why I Choose a 512 Tick Chart over a Time Based Chart
My chart of choice is a 512 tick chart. A tick chart is simply a way of looking at the markets based on the # of trades that take place, versus over time. So a 512 tick chart means that after 512 trades occur the candle closes.
For entry, I like to enter at the 50 percent line. This allows the market to establish an initial direction. And while the market takes a breather, I place my entry. This approach is counter to most newbie traders who chase highs and lows and the move is happening only to get stopped out shortly thereafter on a pullback.
Once the market makes a new high and goes roughly 20% beyond that high, I get out. Simple as that. Think of it as walking into a party 30-mins after the doors open. You already know there’s a party going on, people are already inside, and the line to get into the party is gone. Thus, you walk right up and get right in without waiting.
Pull up a 512 tick chart an take a look for yourself. After a couple hours of looking at the charts you’ll start to see these setups everywhere. I’ll leave you with an example from recent trading.
Thanks for reading.
Twitter: @EminiMind
The author trades stock market futures and may have a position in mentioned securities at the time of publication. Any opinions expressed herein are solely those of the author, and do not in any way represent the views or opinions of any other person or entity.


