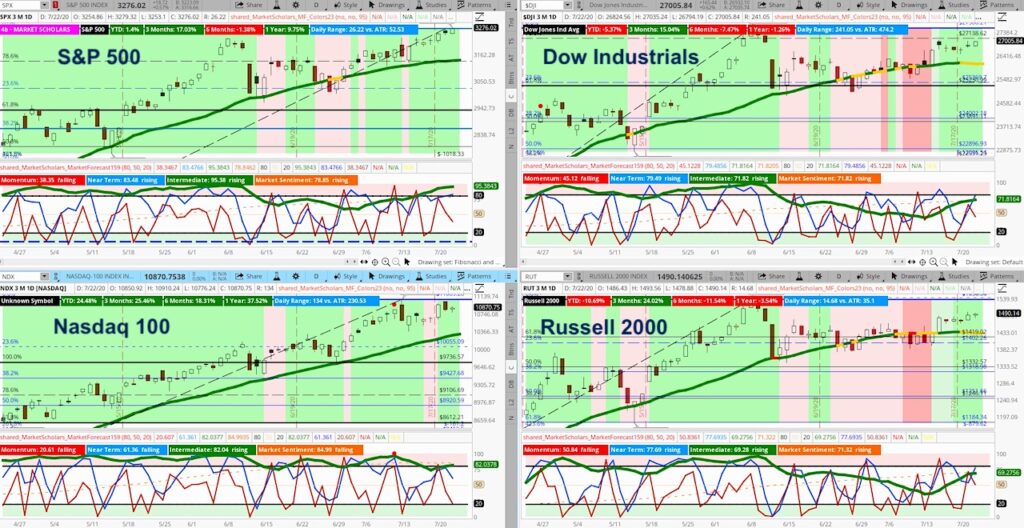
The S&P 500 Index is showing a familiar pattern to previous moves off sharp low points.
This pattern starts with an oversold technical bounce and is followed by a month or two of sideways action and then a new leg higher.
This “pullback” we experienced in June was masked by continued strength in large-cap tech names – though the Dow and Russell 2000 showed deeper declines.
The Dow Jones Industrial Average is forming a golden cross this week on its 10-week and 40-week exponential moving averages. The Russell 2000 Index is only a week or two away from its own long-term bullish crossover signal. Both golden crosses would join the S&P 500 and Nasdaq 100.
These patterns suggest we may see much more upside for stocks in the coming months – even if we experience short-term reversals.
Gold is moving higher due to weakness in the US Dollar. That said, gold is dropping sharply versus Silver, a metal with more industrial uses that reflects growing economic growth expectations.
See further commentary below today’s video.
Get market insights, stock trading ideas, and educational instruction over at the Market Scholars website.
Stock Market Outlook (Video)
Long-term bonds still haven’t unwound much of its strong move higher off its October 2018 lows. Unwinding the safety trade should also provide a tailwind for equities in the coming months.
Despite the occasional outperformance by the smaller sectors in the S&P – Energy, Industrials and Financials, the leadership continues to come from cyclical areas like Technology and Consumer Discretionary. This should continue to be case until the long-term trend matures and there’s more of a significant shift towards value areas.
Twitter: @davidsettle42 and @Market_Scholars
Any opinions expressed herein are solely those of the author, and do not in any way represent the views or opinions of any other person or entity.


