This past week, we saw the technical situation continue to tighten across the core stock market ETFs that we track (referred to here as our Economic Modern Family).
So let’s get right down to the technical analysis of the Economic Modern Family with actionable plans.
It should not come as a surprise to see the Family diverge even further than where it has been over the last 2 months.
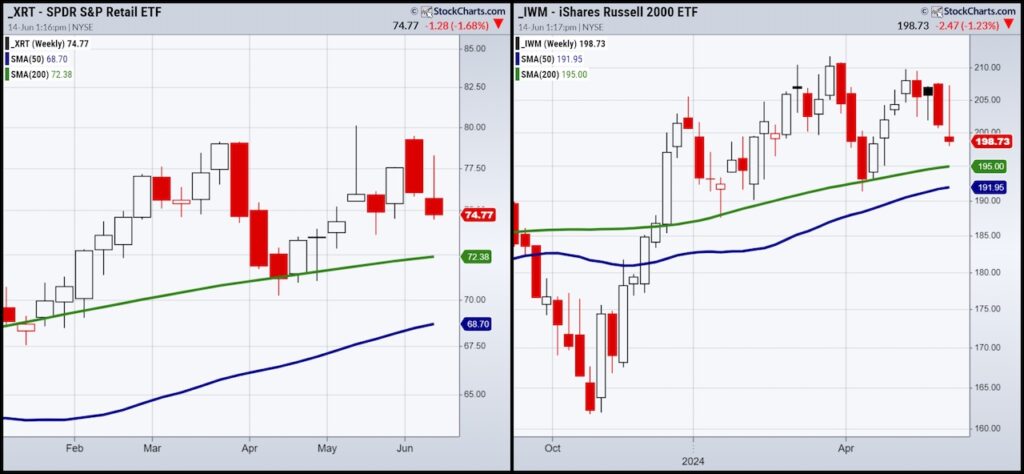
Granny Retail XRT still clings to clutch support with 74.75 pivotal.
That means this week, XRT must hold that level and get back above 76.00 to instill confidence.
Granddad Russell 2000 IWM (along with Granny in weekly accumulation phases), also must hold at the past week lows or around 198.
Plus, if IWM can get back over 202, stories of how undervalued small caps are, we could begin to think perhaps they are undervalued enough.

On the flipside, here are 2 Family members causing us more concern.
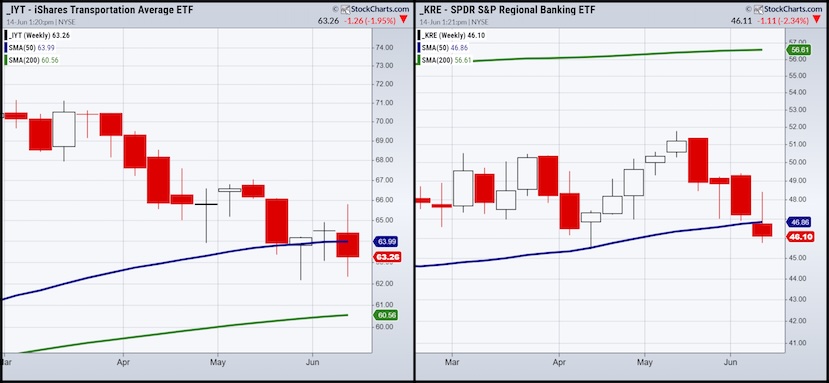
Transportation IYT, a sector many are talking about besides us, has closed the week below the 50-week moving average.
If IYT cannot recover this next week, I would be hard pressed to load up on equities right now-ANY equities.
(Commodities could be a different story)
Regional Banks KRE have also broken the 50-WMA for the first time since last December.
That could be a huge warning as bank failures may not be off the table.
Nonetheless, we will watch to see if KRE recovers or not this coming week.

Biotechnology IBB still intrigues me.
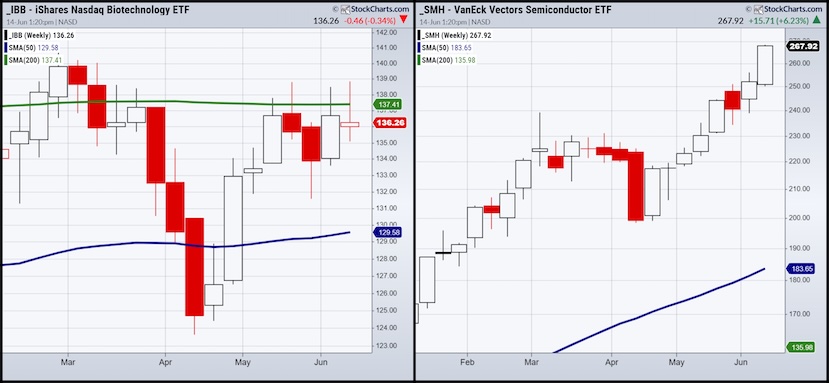
While yet to clear the 200-week moving average, IBB remains steadfast while it continues to hold the 135 area.
If IBB can pop over 138 and stay there, I imagine we could see more upside. I have a few biotech drugs on the radar.
And of course, there is our Sister Semiconductors SMH.
Really, that woman has wings.
But for how long if her Family sputters more?
And here’s the rub.
If the Family hangs tough or rallies from here, we see no topping pattern in SMH yet.
However, should we see more Family weakness, then a move under 240 would be a warning.

Our last member of the Family is Bitcoin $BYCUSD.
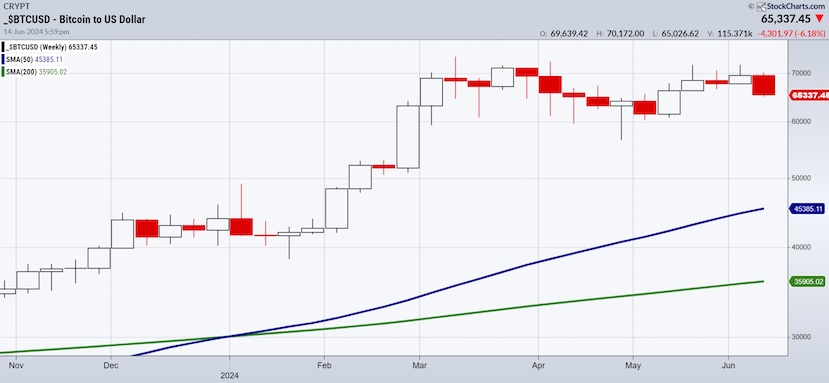
I don’t love that it closed the week (it does trade 24/7) under 66,000.
And on a daily chart, it looks like a double top is possible.
On a weekly basis, the price is fine.
But the 50-WMA is far from current levels.
Bulls do not want to see 45,000.
BTC takes out the recent highs-that is another story.
However, under 60k, 45,000 would be a reasonable next target.
By the way, all this accompanies Long Bonds TLT, which have cleared the 50-WMA handily.
And if they do it again next week-hello stagflation for real-and maybe a steppingstone to recession.
Twitter: @marketminute
The author may have a position in mentioned securities at the time of publication. Any opinions expressed herein are solely those of the author and do not represent the views or opinions of any other person or entity.


