After a very busy week and a Fed pivot, this is a good opportunity to step back and examine the performance of the Family.
We will also look at Bitcoin, 2 commodity index funds and long bonds.
The intent is to come up with a plan for this coming week.
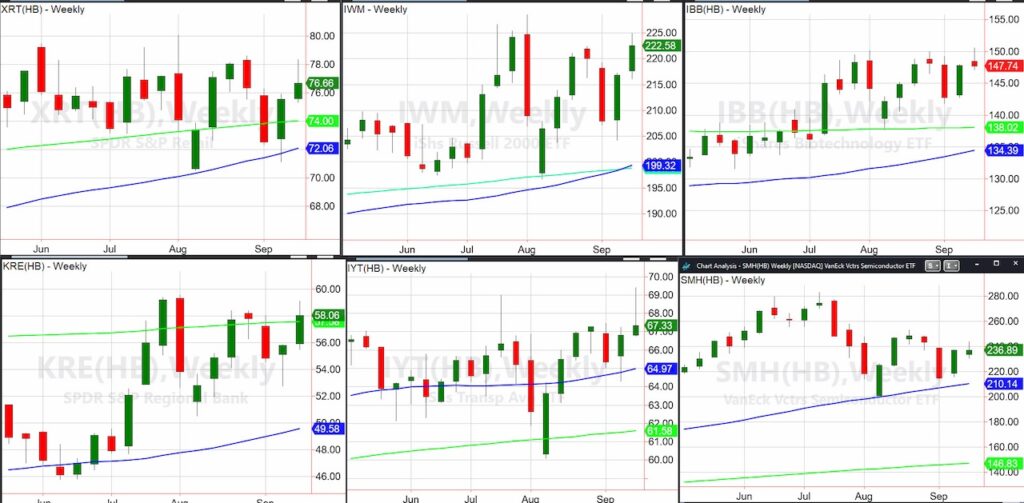
Starting with Retail, in a recent Daily I wrote, “Granny Retail XRT continues to have my attention. I will follow her. Over 80 I am all in on a bull run in equities. Under 70, I am cautious, if not bearish, in equities.”
Looking at the weekly chart of XRT, neither happened. XRT did not break 80 nor fail 70. Instead, the sector remains more in the middle of the range from May to September.
Granddad Russell 2000 IWM, in a bit of a stronger chart position than Granny, nonetheless behaved similarly.
The good news is we have a new range to watch from 215-225. Note the golden cross on the weekly moving averages, so perhaps we can count on small caps to decidedly take advantage of the lower rates.
Big Brother Biotech IBB failed once again at the 150 level. However, the ETF did not fall too far. Hence, this coming week, we are looking at a firmer breakout over 150 to follow.
Several weeks ago, I showed you the weekly chart of Bitcoin. Just as the bears emerged, the longer timeframe chart kept us calm and bullish.
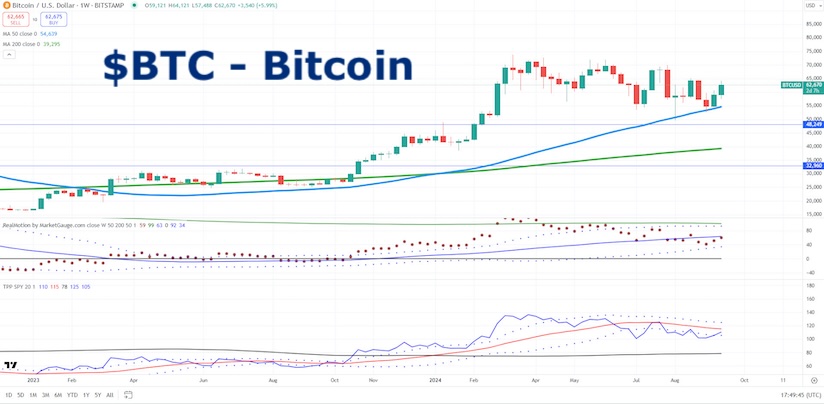
Bitcoin has more work to do, but leadership against the SPY is improving.
Momentum is still not wowing us.
We are looking for BTC to hold 55k and eventually clear 65k, on its way to 85k.
Back to the weekly charts of the Family, Sister Semiconductors SMH did what we would have expected from that sector-stayed rangebound neither leading nor lagging.
Let’s not lose sight that SMH is still above the 50-WMA and in a weekly bull phase.
Unless that changes, we just need tech to hold up.
Transportation IYT though, which looked ripe to close on new 2024 highs, got a bit more sober on the FedEx earnings.
However, IYT fell back into support levels and needs to maintain its weekly bullish phase for confidence in the market.
Finally, Prodigal Son Regional Banks KRE gets the award for being well, the Prodigal Son and closing over the 200-WMA.
KRE needs to continue to hold over the 57 level for another long week so stay tuned.
And Commodities?
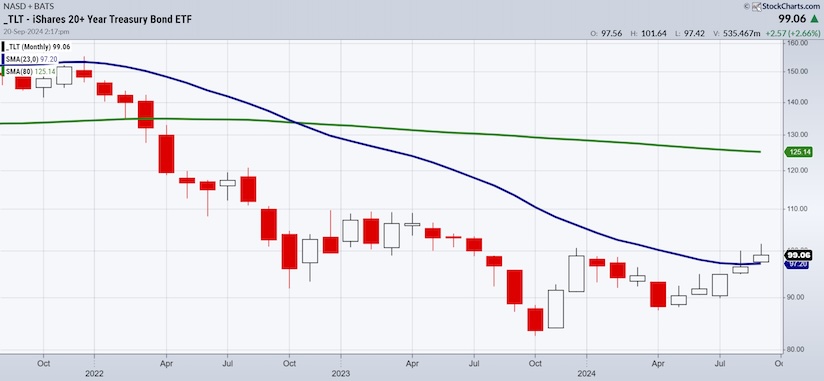
Starting with Long bonds TLT, this is a monthly chart.
While the Fed lowered and long bond yields rose from the lowest point of the week, the TLT remains above the closing levels of August and above the 23- month moving average (blue).
The price has traded below the 23-MMA for 3 ½ years, which suggests that a bigger rally in TLT is coming.
What does that mean for commodities?
Individually, sugar made a huge move to prices not seen since March.
Gold traded at new all-time highs. Silver cleared $31.00 and looks poised to continue to run.
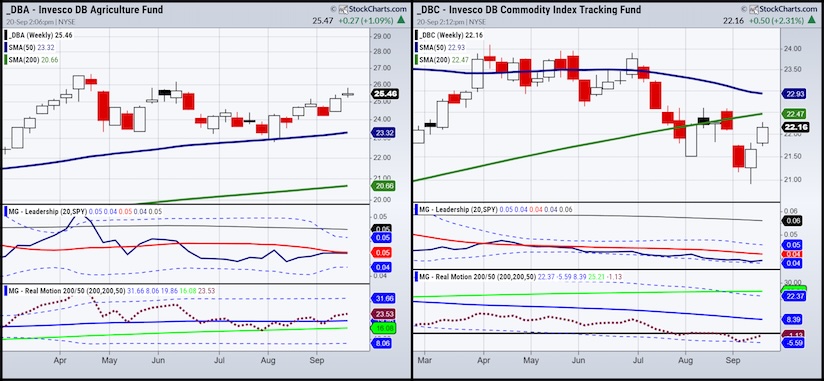
For consistency purposes, the weekly charts of 2 different commodity funds (DBA DBC) are great charts to focus on in the coming weeks given the rate cuts and the metals rally.
DBA, the more agricultural dominated, closed on a new multi-week highs. DBA looks like it could overtake SPY in leadership. Momentum is in align with price.
Above 26, we would take that as a sign inflation is picking up way more than what the media would like folks to believe.
DBC, the more metals and energy dominated, improved in phase on the Daily charts to recuperation.
DBC well underperforms SPY. Momentum tells us that the price may have bottomed out and now we will watch the weekly MAs to clear.
A move over 23.00 would be the most compelling.
Our plan this week is to watch the “inside” sectors for clues. Can XRT IWM IBB and IYT continue to hold up, or even better, rally to new 2024 highs?
If so, then despite the doomers, this is a healthy broadening out for the market.
Can silver clear $32.00?
If so, we will watch for a flip in the silver to gold ratio in favor of silver. That is inflationary.
Finally, we will watch the long bonds. If TLT has found support, what does that mean for the US dollar, the commodities and equities?
We remain in the stagflation camp. But, we also know that flexibility is key for this volatile time.
Jeremy Szafron and I sat down at Kitco for a great conversation on market expectations. Have a listen here.
Twitter: @marketminute
The author may have a position in mentioned securities at the time of publication. Any opinions expressed herein are solely those of the author and do not represent the views or opinions of any other person or entity.
: Creating Bullish Divergence?")


 and Semiconductors (SMH): Concerning Price Pattern?")


