When stocks are in a bull market, we tend to see assets like growth stocks and junk bonds perform well as investors are in “risk-on” mode.
And often times, these are the assets to start under-performing when the stock market goes through a sell-off or correction.
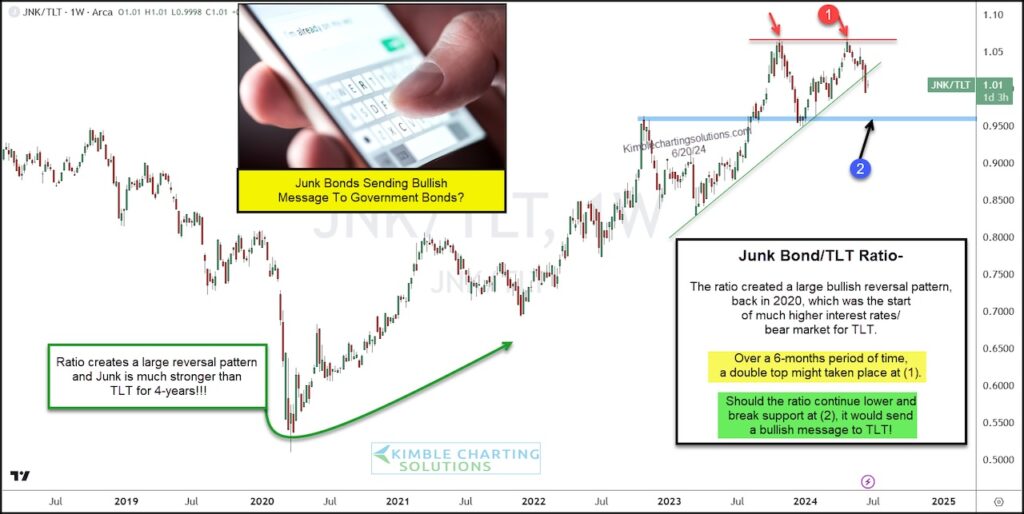
Today, we pit one of these assets (junk bonds via the ETF $JNK) against its counterpart government bonds via the ETF $TLT. And we do this using a “weekly” price ratio chart.
As you can see, the ratio sent a very bearish message to TLT back in 2020 as JNK began out-performing TLT. And this has also coincided with a big equity bull market.
Fast forward to today, and we can see that the ratio formed a double top at (1) and is breaking down through up-trend support.
So I humbly ask, is the ratio now sending a bullish message to TLT? While simultaneously sending a potentially bearish message to equities? If support gives way at the neckline of the double top at (2), I suspect that it is. Stay tuned!
$JNK Junk Bonds ETF / $TLT Treasury Bond ETF “weekly” Ratio Chart
Note that KimbleCharting is offering a 2 week Free trial to See It Market readers. Just send me an email to services@kimblechartingsolutions.com for details to get set up.
Twitter: @KimbleCharting
The author may have a position in mentioned securities. Any opinions expressed herein are solely those of the author, and do not in any way represent the views or opinions of any other person or entity.

 Fails Key Support Level; What’s Next?")
 Weakness Remains; Sell Rallies?")
 Is A Favorite AI Stock: What About Timing?")


