With yields trading at elevated levels and stocks trading at depressed levels, it makes sense that junk bonds are not faring well this year.
BUT they are trying to re-group for a potential rally… and stock bulls would love to see risk-on “junk” rally. They have their fingers crossed!
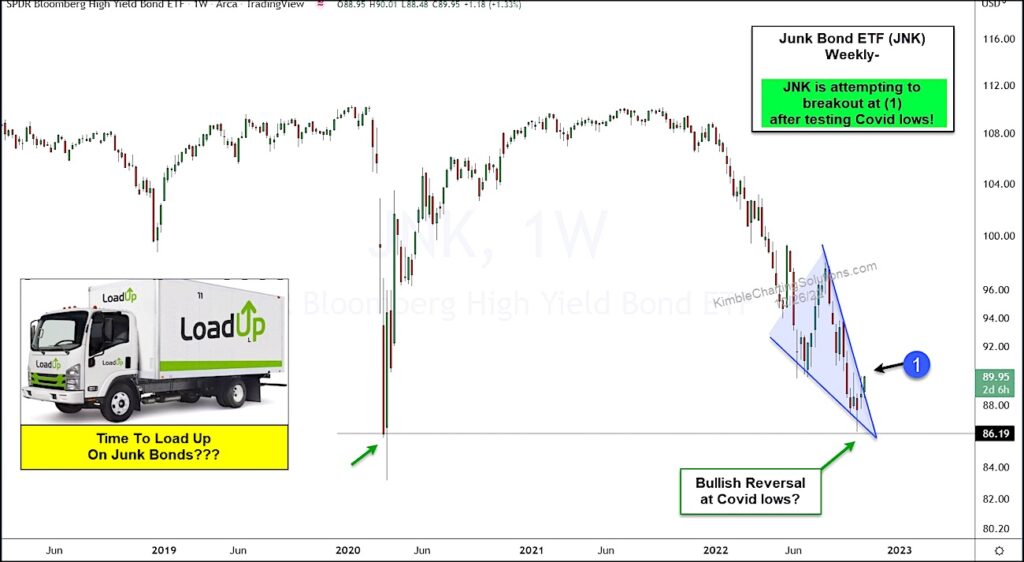
Today’s chart is a “weekly” chart of the Junk Bond ETF (JNK). As you can see, JNK tested its Covid lows before reversing higher. This bullish reversal has junk bonds attempting to breakout of a descending wedge pattern at (1).
Bulls will definitely want to watch this week’s close and look for follow through next week. A strong breakout would be a positive message for stocks. Stay tuned!
$JNK Junk Bonds Chart

Note that KimbleCharting is offering a 2 week Free trial to See It Market readers. Just send me an email to services@kimblechartingsolutions.com for details to get set up.
Twitter: @KimbleCharting
Any opinions expressed herein are solely those of the author, and do not in any way represent the views or opinions of any other person or entity.


