Since the end of 2023 and throughout most of 2024, the high yield, high debt bonds have been on a tear.
However, the party could be over. Emphasis on could be.
I follow the junk bonds closely, as they literally told us to exit the market and buy long bonds right before Covid hit.
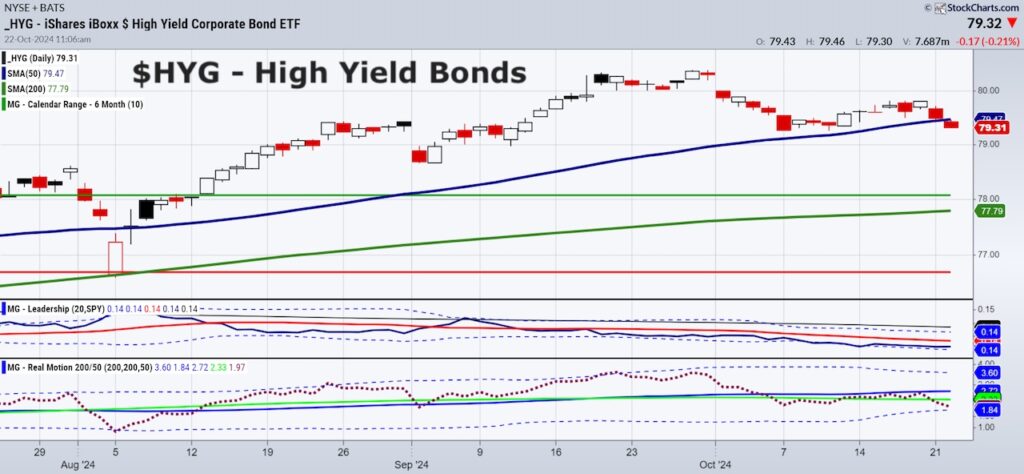
Looking at today’s Daily chart of HYG, the price entered an unconfirmed warning phase today.
This is noteworthy as it is the first time the price fell below the 50-DMA since March 2024.
Nonetheless, that must confirm, plus, the slope on the 50-DMA remains up.
Furthermore, the good news is that HYG is underperforming SPY, which is risk on.
And HYG outperforms TLT the long bond, also risk on.
While this phase change could be premature, I do think it important to be prepared for different scenarios as the election gets nearer.
Real Motion shows a bearish divergence in momentum.
Moving on to the weekly chart:
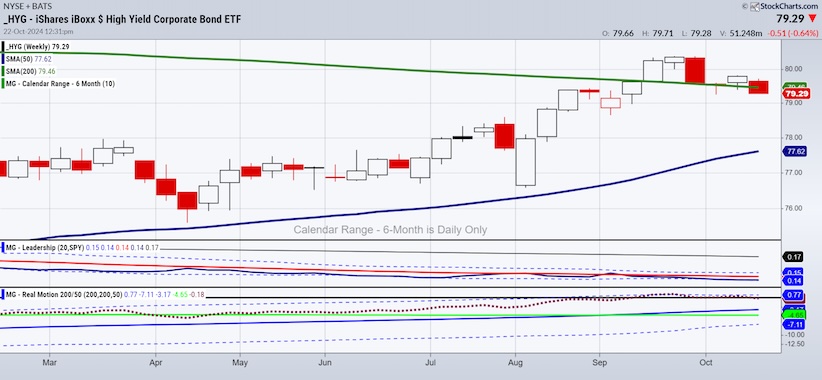
HYG is back beneath the 200-week moving average.
The daily chart shows a caution phase, while the weekly chart shows a recuperation phase.
But both are negative phase changes.
As the week has just begun, we need to keep eyes on that 200-WMA.
(The real fun does not begin unless HYG breaks below the 50-WMA, which it has been above all year.)
From this viewpoint, we need to prepare for either
- HYG pops back over both the 50-DMA and 200-WMA thereby flashing a lot more risk on in store-good news
- HYG deteriorates from here further, hence, we see SPY wobble, and should the long bonds catch a bid, we got trouble.
The monthly chart is also interesting.
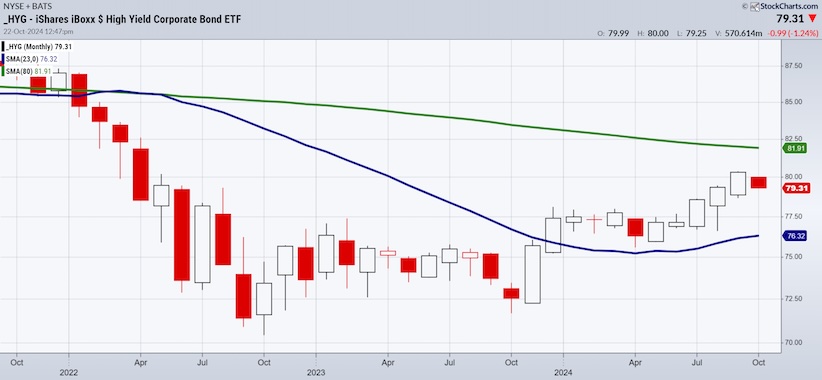
So far, this month is trading within the range of last month.
That is significant.
In September, the 80.37 high and 78.65 low is a good range to watch.
Given both the Daily and weekly charts both showing a potential inflection point in the works, the monthly chart gives us a better perspective.
Note how the price cleared the 23-month moving average aback in late 2023.
That was a clear signal to go long given the switch to risk on.
Now, as we enter the last quarter, elections, and more inflation, remember the market remains risk on but we need to watch for potential cracks. Just in case.
Twitter: @marketminute
The author may have a position in mentioned securities at the time of publication. Any opinions expressed herein are solely those of the author and do not represent the views or opinions of any other person or entity.
: Creating Bullish Divergence?")

 and Semiconductors (SMH): Concerning Price Pattern?")
 and Semiconductors (SMH): Concerning Price Pattern?")


