VIX Volatility Index –
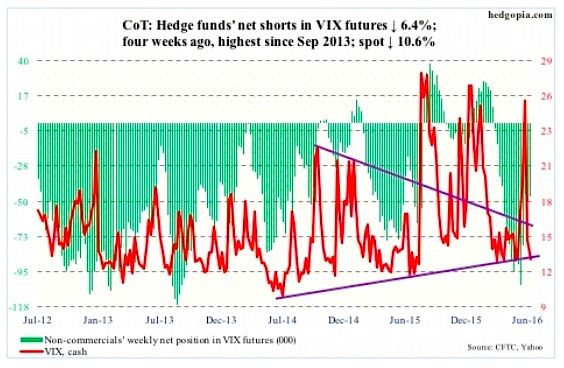
On both Tuesday and Wednesday, spot VIX sought to break out of a months-long range but was denied. Friday, it was pushed to the bottom end of that range. In the recent past, it has managed to rally from the 12 to 13 range.
The VIX-to-VXV ratio ended the week at 0.8 – now in oversold territory. Two weeks ago, it spiked to 1.08, and needed unwinding, which helped stocks.
July 8 COT Report Data: Currently net short 46.9k, down 3.2k
CURRENCIES
Euro –
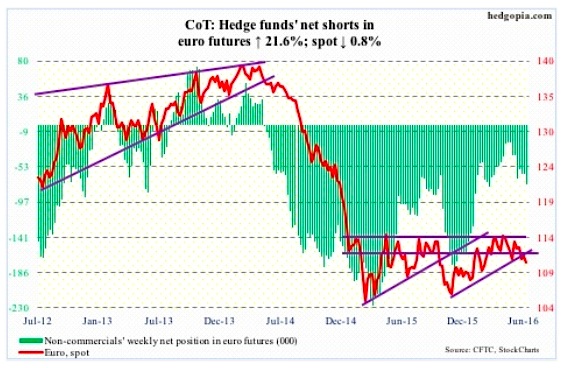
One would have thought the sudden rise in concern over the stability of Italian banks that hold billions of euros in bad loans would hammer the euro. It is holding up just fine, with the currency down 0.7 percent for the week. Post-Brexit, Italy’s bad loans have been thrown into the limelight as prospects for Eurozone growth dim. More stimulus from the ECB then? It next meets on July 21st.
Minutes for the last ECB meeting showed policymakers were worried that a U.K. decision to leave the EU could unleash significant negative repercussions for Eurozone growth. The ECB is already buying around €80 billion a month of private and public debt, and has cut the benchmark interest rate to a record low of minus 0.4 percent. The balance sheet has grown from €2.04 trillion in September 2014 to €3.08 trillion in May. Hawks will fight tooth and nail against further stimulus.
July 8 COT Report Data: Currently net short 75.3k, up 13.4k.
US Dollar Index –
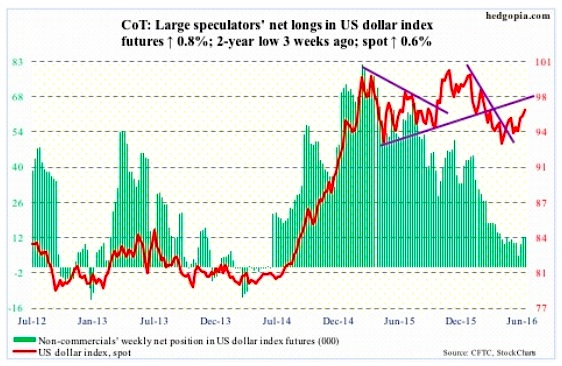
Reacting to Brexit on June 24th the dollar index rallied 2.7 percent but was rejected intra-day at its 200-day moving average. In the nine sessions since, the index continues to hover around that average, but the latter continues to stand tall. Friday produced a long-legged doji.
There is not much change in the bigger picture. The index is stuck in the middle of a 15-month range – 100-plus on the up and 93-plus on the down.
Ditto with non-commercials’ sentiment. They continue to act tentative.
July 8 COT Report Data: Currently net long 12.3k, up 100.
ECONOMIC REPORTS
Major economic releases next week are as follows.
Tuesday brings the NFIB optimism index (June) and JOLTS (May).
In May, small-business optimism inched up two-tenths of a point to 93.8. The cycle peaked in December 2014 at 100.3 – the highest since October 2006. Their capex plans were 23 in May, down from the cycle high 29 in August 2014.
Job openings rose 118,000 month-over-month in April to 5.78 million, matching the high of July last year. Which also means openings have been flat for 10 months.
PPI-FD for June is published on Thursday. Producer prices rose 0.4 percent in May. In the 12 months through May, they fell 0.1 percent. Core prices dropped 0.1 percent in May, and were up 0.8 percent in the 12 months through May.
Friday brings CPI (June), retail sales (June), industrial production (June), and the University of Michigan’s consumer sentiment (July, preliminary).
Consumer prices rose 0.2 percent in May. In the 12 months through May, prices increased one percent. At the core level, prices advanced 0.2 percent, and 2.2 percent in the 12 months through May.
Industrial production was down 1.3 percent year-over-year in May, and has been down for nine consecutive months. Similarly, capacity utilization, at 74.9 percent in May, has declined y/y for 15 straight months. Utilization peaked in November 2014 at 78.9 percent.
Consumer sentiment fell 1.2 points in June to 93.5. Sentiment peaked in January last year at 98.1, which was an 11-year high.
Six FOMC members have scheduled appearances on weekdays.
Thanks for reading.
Twitter: @hedgopia
Author may hold a position in mentioned securities at the time of publication. Any opinions expressed herein are solely those of the author, and do not in any way represent the views or opinions of any other person or entity.


