To repeat on the importance of the July (and January 6-month calendar ranges)
The Six-Month Calendar Ranges
- Provides directional bias for the next 6 to 12 months.
- January and July divide the year
- Simple levels that matter + the right indicators and tactics.
Overall, we look at 2 simple things.
- If an instrument breaks out of the range or breaks below with momentum and price and then has follow through.
- If an instrument breaks out or down and then reverses back into the calendar range high and low.
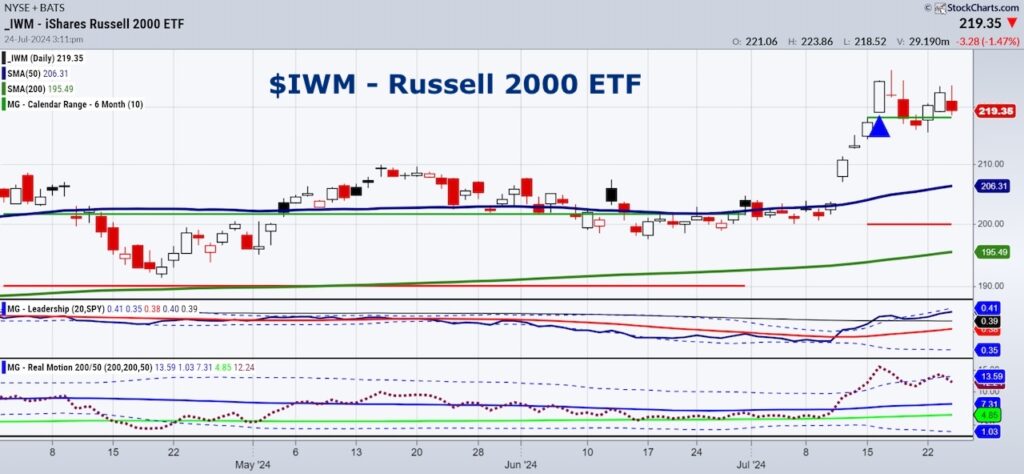
Looking at IWM or the small caps, any question on whether this is the new kid (in our case new Granddad) in town, is answered.
Holding above the July range (green horizontal line) is a positive.
Of course, should the market fall further that could change.
Nonetheless, if the market firms from here, IWM is a good place to go for more upside.
On the flipside, and completely different that what we have seen for the last 2 years, our Sister Semiconductors SMH is having a hard time.
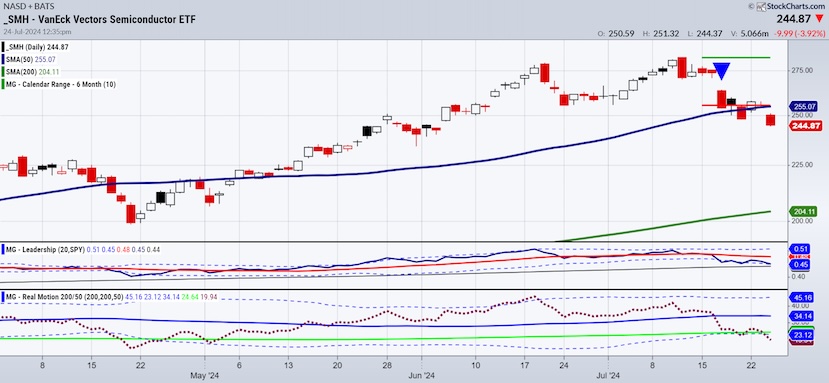
SMH not only failed to clear the July range high, but it also broke the low last week.
Now, SMH is in an unconfirmed warning phase, trading under the 50-day moving average.
The momentum or Real Motion indicator is pointing to oversold.
Hence, we could see a bounce tomorrow perhaps back up towards the 50-DMA.
But unless we see a real reversal with price back through the calendar range lows, we can assume that the trend is real.
Money continues to rotate into small caps and out of Mega caps.
Twitter: @marketminute
The author may have a position in mentioned securities at the time of publication. Any opinions expressed herein are solely those of the author and do not represent the views or opinions of any other person or entity.
: Creating Bullish Divergence?")


 and Semiconductors (SMH): Concerning Price Pattern?")


