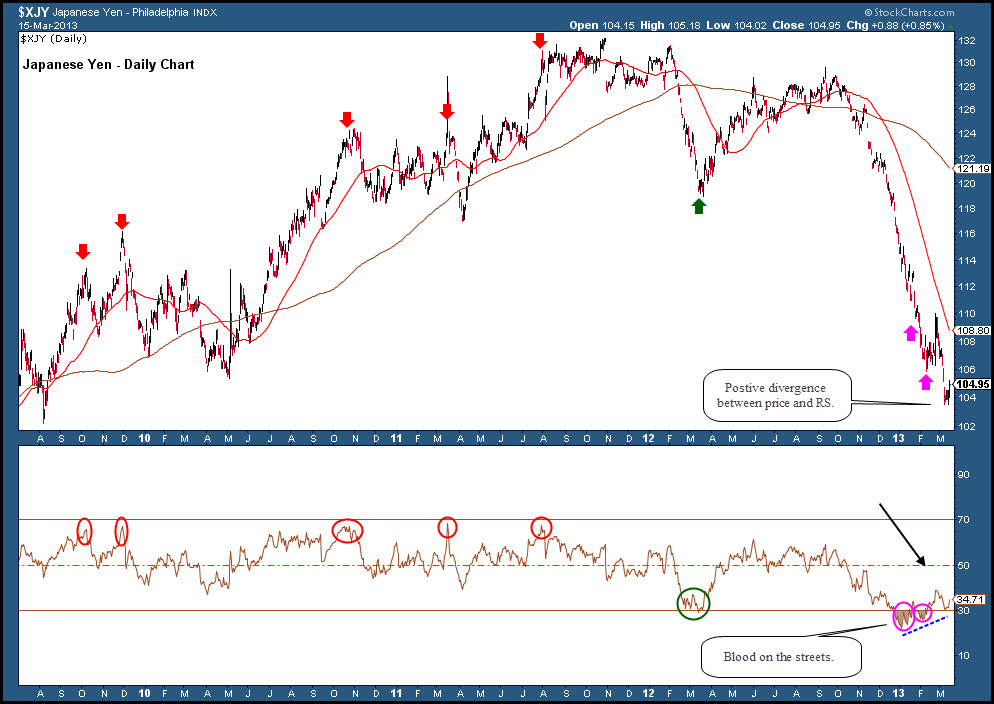
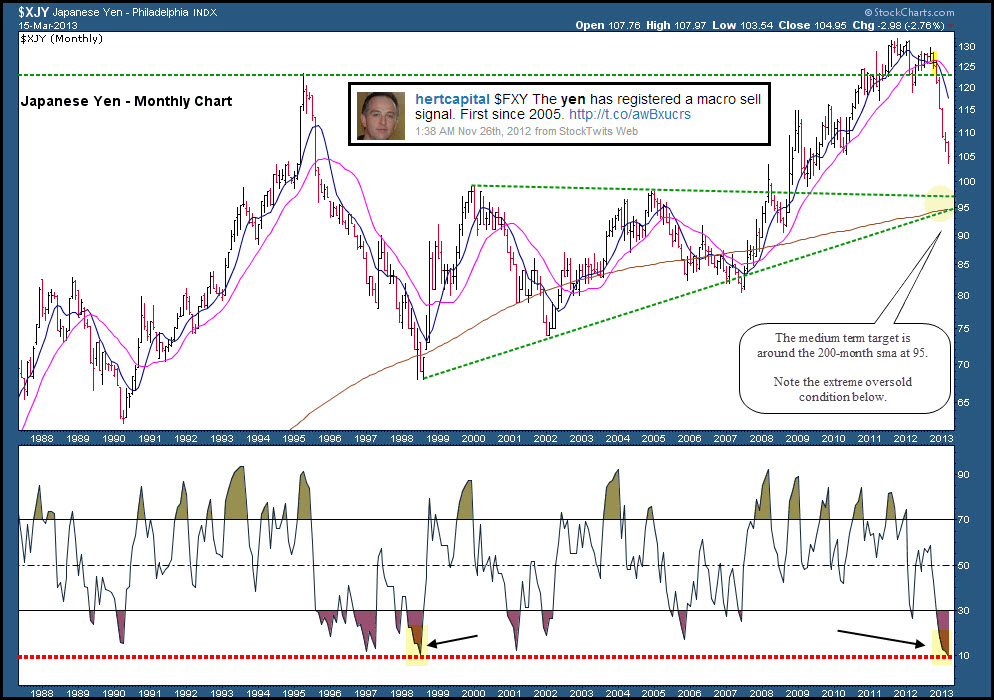
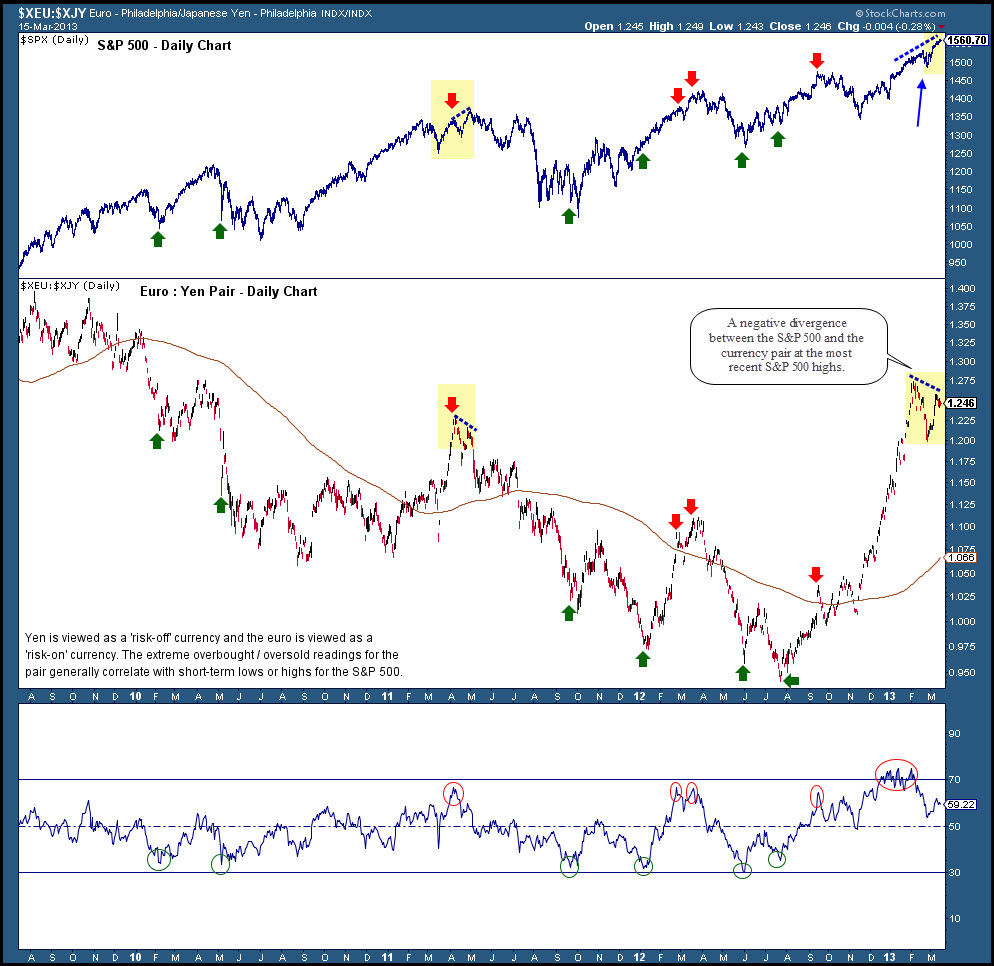
 By Sheldon McIntyre The Japanese Yen has fallen in a waterfall-like decline for the past 6 months, but indications are emerging that the currency may be nearing a “bounce.” Below, I have included three annotated charts looking at the Japanese Yen from a daily perspective, monthly, and in a pair, Euro:Yen.
In summary, the daily chart shows an RSI divergence, while the monthly chart highlights an extreme oversold condition. And finally, the Euro:Yen pair shows a negative divergence between the pair and the S&P 500. All in all, the theme of the charts is that a bounce for the Yen is near. Click charts to enlarge.
Daily Japanese Yen Chart:
Monthly Japanese Yen Chart:
Euro:Yen Chart:
Trade safe, trade disciplined.
Twitter: @hertcapital @seeitmarket
No position in any of the securities mentioned at the time of publication.


