Monday, after a lot of spooky headlines, the SPY touched the 23-month moving average or the 2-year biz cycle breakout point right around 417.
Plus, TLT flashed green as did IWM, the small caps.
Now, the big question is can IWM close out Oct above 170?
If not, any rally will be short-lived.
Today was an interesting day.
SPY also cleared back over the 200-DMA which if holds, could mean more relief rally.
BUT-TLT reversing as well so what we don’t want is for the long bonds to outperform SPY.
Why?
1. That would be risk-off and recessionary
2. It would embolden the already bold commodities to run-especially with the dollar falling.
Which we see as stagflation.
From a technical standpoint, yes, this is a mean reversion.
However, if you look back to July, it is the 5th oversold rally in TLT.
Sustainable?
The biggest fundamental dynamic is that inflation can go hyperbolic (it already is in certain soft commodities because of the geopolitical soup).
And, if the FED relaxes now, one must wonder if they will be caught from behind once again.
Nonetheless, for us the most important aspect to this is how TLT performs against the SPY and how HYG (junk bonds) perform against the TLT.
Bulls want TLT to underperform both.
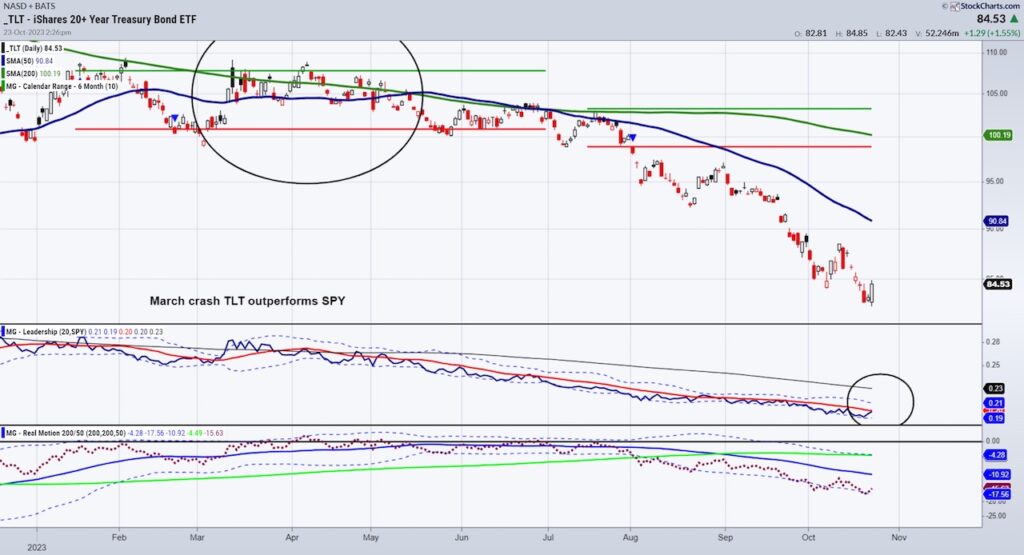
Note the ellipses and text on the chart of TLT or the 20+ Year long bonds.
Back in March when we had the bank crisis flash crash, bonds signaled a flight to safety by outperforming the SPY starting March 7th.
At the same time, the price was around 101.
Real Motion was showing a bullish divergence in momentum as TLT crossed over the 50-DMA long before the price did.
SPY crashed, and TLTs rallied to 109.10 in a matter of days.
Fast forward to today, TLT remains slightly underperforming the SPY.
The momentum indicator shows a mean reversion but not a bullish divergence.
Should TLT do what it did in March-outperform the SPY-take that as a warning.
That is a sign of risk off, and perhaps a harbinger of an oncoming recession-or worse, stagflation.
Let’s not freak out yet though.
It is always good to plan ahead yet act on price accordingly.
Stock Market ETFs Trading Analysis & Summary:
S&P 500 (SPY) 417-420 support
Russell 2000 (IWM) 170 now in the rearview mirror
Dow (DIA) 332 pivotal
Nasdaq (QQQ) 351 recent low and support
Regional banks (KRE) 35 next support
Semiconductors (SMH) 140 support
Transportation (IYT) 225 pivotal
Biotechnology (IBB) Under 120 so 110 area next support
Retail (XRT) 57 key support still
Twitter: @marketminute
The author may have a position in mentioned securities at the time of publication. Any opinions expressed herein are solely those of the author and do not represent the views or opinions of any other person or entity.


