 In the latest swing higher off the April 18/19 lows in U.S. equities, the crowd shifted from defensive names that had outperformed so far this year into technology (previously a big laggard), industrials, and financials. Position traders don’t want to chase the current move as the market is stretched and at a heightened risk of reverting to the mean, even if only temporarily. If anything, it’s a good time to secure a gain, or at least a partial gain, and wait for the next dip before buying more. So what do you do in the meantime? Try looking abroad. Consider investing in Mexico via the iShares MSCI Mexico (EWW). This ETF has been asleep for a little while – often the best time to enter a position – but looks ready to wake up soon.
Let’s start with a look at the iShares MSCI Mexico on its own and then compare the ETF with the value of the peso to the dollar. Mexico has an export-oriented economy and 78% of its exports went to the U.S. in 2012; this means a weaker peso makes its goods and services more attractively priced. And this is generally good for the country’s stock market. Click to enlarge.
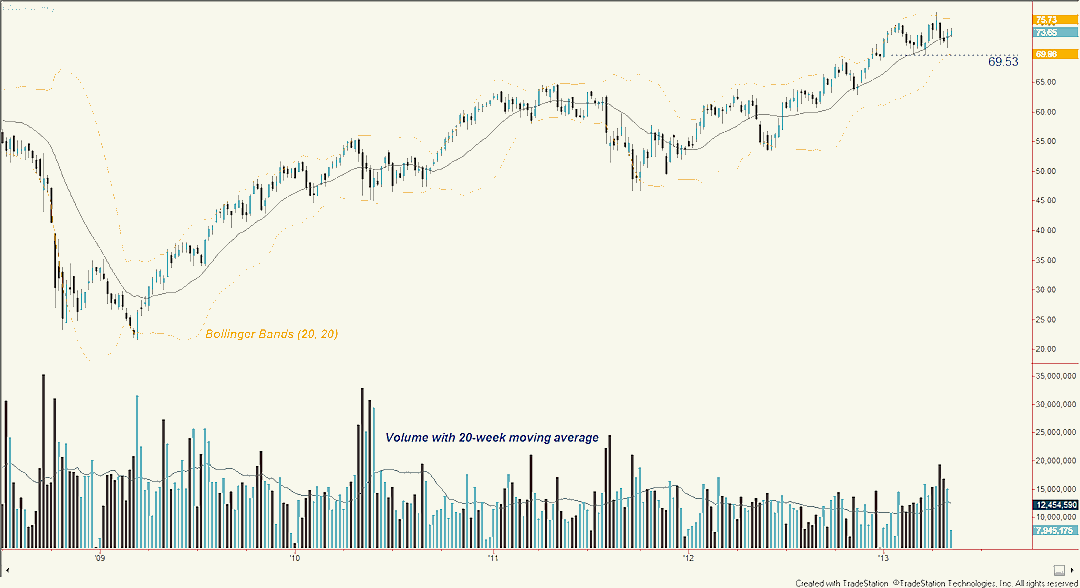
iShares MSCI Mexico (EWW) 5 Year Chart
As you can see on the weekly interval chart, EWW has been consolidating since the start of February. During this time the 20-week simple moving average has continued higher, affirming the primary uptrend since October 2011. Pullbacks to the average haven’t followed through lower. During the most recent downleg – in the weeks ending 4/19 and 4/26 – volume swelled to as much as 60% above the 20-week volume moving average. That suggests a lot of supply was expelled from the market without any technical damage being done to the larger price structure. As long as a recent floor at 69.53 isn’t breached, the uptrend won’t be challenged.
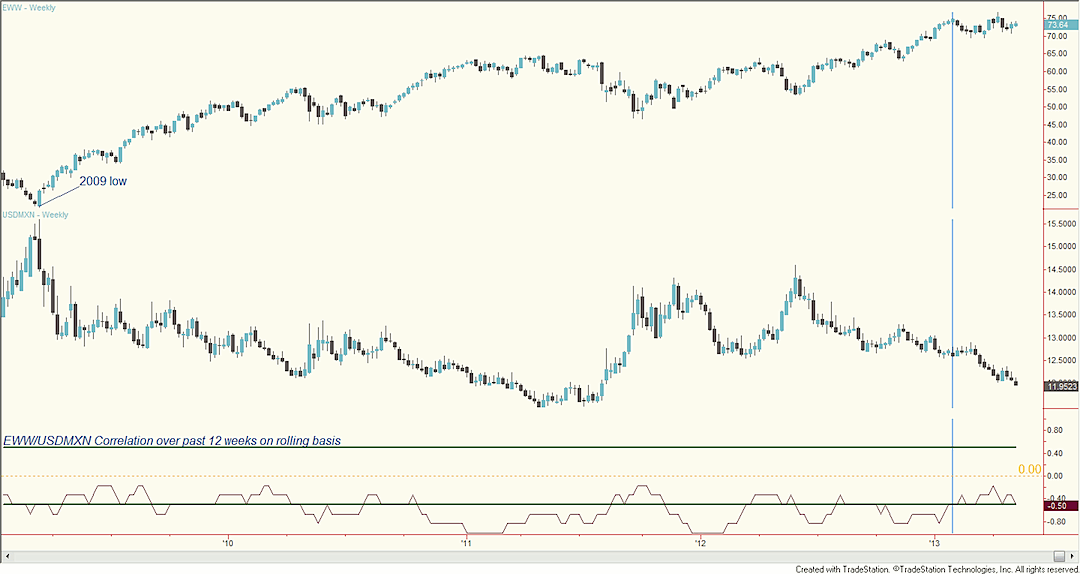
Now let’s look at the EWW relative to USDMXN (rising trends translate to peso strength, falling trends peso weakness). At first glance just look at price. You can see that since the 2009 low in EWW and peak in USDMXN, the two markets have been near opposite images of each other in terms of direction. Periods of peso weakness – good for exporters – have consistently been accompanied by higher share prices, and vice versa.
iShares MSCI Mexico (EWW) vs. USDMXN Chart
Next, look at the line at the bottom of the chart indicating correlation over the past 12 weeks (three months) on a rolling basis. Since 2009, the negative correlation has been fairly constant. It has never gone higher than -0.17, and ascents to that height never lasted long. Meanwhile, most of the time since the middle of 2010, the correlation has been lower than 0.50, showing a statistically significant inverse relationship between the two markets.
With that in mind, direct your attention to the light blue vertical line, which denotes the week ending 2/1, when the iShares MSCI Mexico (EWW) began to consolidate. Since then two things have happened. One, the peso has weakened significantly. Two, the correlation moved above -0.50. Since mid-2010 periods above -0.50 haven’t lasted long. Unless the relationship between the two markets is changing, recent history suggests a more deeply negative correlation should resume soon. So there’s a good chance EWW will catch up to the weakening trend in the peso by breaking higher.
Finally, let’s turn to trading tactics. Addressing macro developments helps arrive at an estimate of which way price is likely to resolve, but following strict trading and money management rules are of far greater importance when trying to hit consistent singles and doubles that build capital over time.
One of the best tactics for position traders (two- to 12-week horizon) is entering the market when it’s consolidating, setting a stop loss and letting the trade evolve. Markets tend to shift between periods of stability in which supply and demand are in balance, and instability when the market runs to the next equilibrium at a higher or lower level. If you wait for the market to start running, price will be far away from a reasonable place for a stop, increasing risk and resulting in you chasing a move that’s already underway. If you enter during the quiet period, price will be closer to a reasonable place for a stop, risk will be better contained and reward potential greater.
With a stop placed somewhere beneath the 69.53 floor, risk is a little under 6%; any short-term declines would bring that number down further. Regarding reward potential, if the iShares MSCI Mexico (EWW) resolves the recent consolidation higher, it’ll be in unchartered territory, making it difficult to estimate upside potential. That’s okay. Trend following techniques are generally more effective in trading than getting married to a specific target anyway. In the beginning some flexibility is appropriate to give the trade a chance to prove itself. If it does, you can then look to the 20-week average as an indication into the health of the trend. As long as it’s rising, the trend isn’t deemed to be in jeopardy. A close of some percentage beneath the average, or a downturn in the average, could be used as a technique for a trailing stop if the market moves in the direction of the trade. You can learn more about myself and my investment strategies at miAnalysis.com. Thanks for reading.
Twitter: @ChrisBurbaCMT and @seeitmarket
No position in any of the mentioned securities at the time of publication.
Any opinions expressed herein are solely those of the author, and do not in any way represent the views or opinions of any other person or entity.


