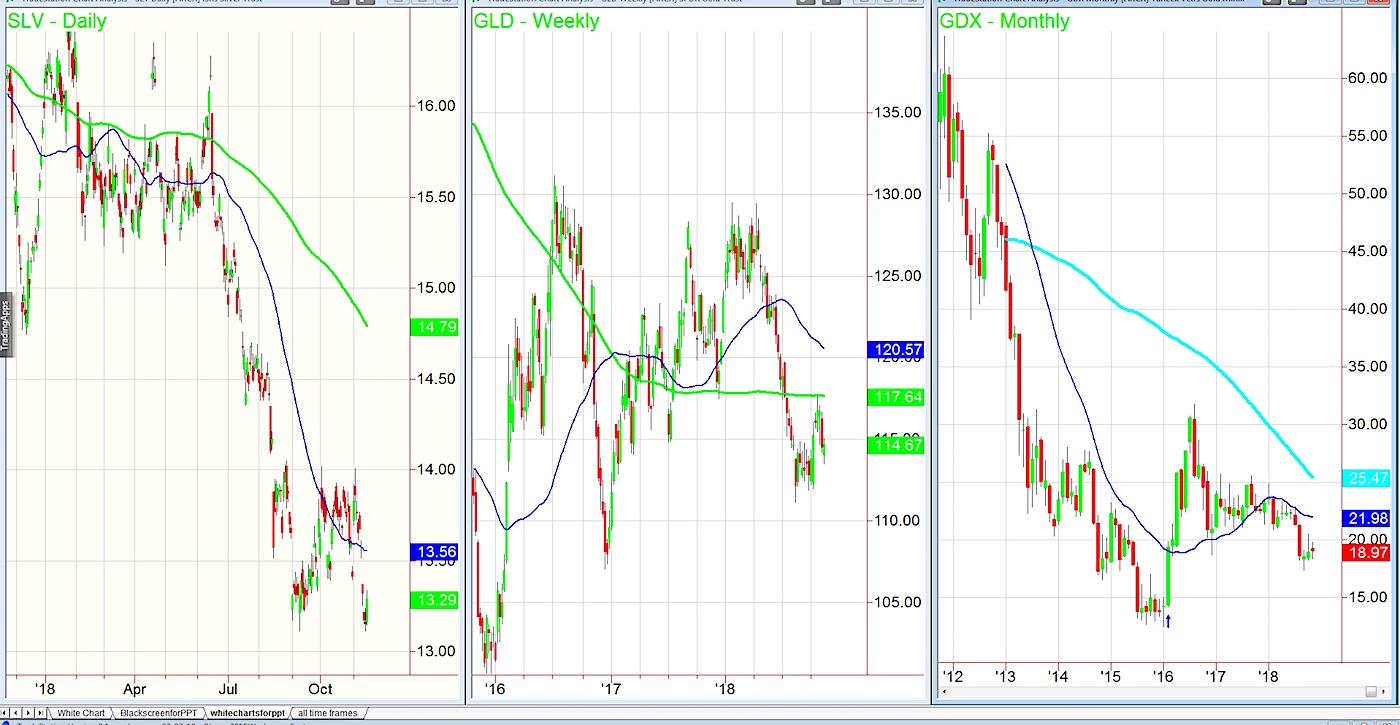
Today, investors may have gotten a glimpse of what could be the impending dilemma for the market as it ends 2018 and begins 2019. And it centers around the Dollar, interest rates (the Fed), the economy, and its implications for Gold, Silver, and precious metals.
For us, this is not a new conversation.
Rather, the difference now is that although the conversation may be old, the evidence to support that conversation is relatively new.
The US Dollar, after making a new multi-year high this week, fell considerably over the last two days.
Interest rates, in reaction to the market sell-off, eased to a degree.
I say to a degree for two reasons.
First, the Federal Reserve understands a change in policy from raising the rates to one of easing will potentially spark inflation.
Secondly, although they may not raise in December, no action will also be interpreted as dovish.
Given the issues we are seeing globally, a declining dollar makes more sense to us than a rising one.
Furthermore, although economists are starting to predict a recession coming in the next two years, I still see the chance for stagflation.
The difference?
The economy stagnates while inflation grows.
All these factors affect the metals.
Hence, with the rally in gold, silver and the miners, is this the start of something bigger for precious metals?
The Silver chart (NYSEARCA: SLV), is on a daily timeframe.
The Gold chart (NYSEARCA: GLD), is on a weekly timeframe.
The Gold Miners chart (NYSEARCA: GDX), is on a monthly timeframe.
I did that purposely to give you perspective.
On the SLV chart, on 9/11 the low was 13.11. Yesterday, SLV made the same low.
In 2015, the low was 13.04. So as support levels, seems safe to say 13.00 is a great line in the sand.
Today, SLV confirmed a reversal pattern on huge volume. Still in a bearish phase, that could be the start of a bigger rally.
GLD, in better shape than SLV, have first to confirm the Recovery phase or two closes over the 50 Daily Moving Average.
On the weekly chart, 112 is its wall of support. And a move back over 115-115.50 should attract new buyers.
The Miners GDX, also in better shape than SLV, has made higher lows the last three months.
Like GLD, it has to have two closes over its 50 Daily Moving Average.
Then, considering this month it is trading inside the range of last month, should GDX clear 20.51, that could be explosive to the upside.
The metals saw some big buyers today as represented by the huge volume.
However, the public is far from catching on.
That means you have time to watch the trend of the dollar, metals and rates, and, if these predictions pan out, not worry about mising out.
Trading levels for key stock market ETFs:
S&P 500 (SPY) – 268.12 fills a gap, which would be way better if it holds. 270 is the nearest resistance. Also note this is back under the 50 WMA.
Russell 2000 (IWM) – Closed under 150.50, which unless it clears back above and holds, most likely means 145.50 is next support to see
Dow Jones Industrials (DIA) – Tested the 200 DMA at 251 and held it. That’s also where the 50 WMA likes so big number
Nasdaq (QQQ) – 170 now resistance and 162.50 closest support. Also note this is back under the 50 WMA.
KRE (Regional Banks) – Broke 55.00, now resistance. Could see 51.50 next.
SMH (Semiconductors) – Good relative strength here today. 94 still the resistance point with 88.50 next support
IYT (Transportation) – 190 resistance and still has a little support at 186.50
IBB (Biotechnology) – Broke below the 200 WMA at 104.75-now resistance
XRT (Retail) – Closed under 47.80 or the 200 DMA putting this into an unconfirmed Distribution phase
Twitter: @marketminute
The authors may have a position in the mentioned securities at the time of publication. Any opinions expressed herein are solely those of the author, and do not in any way represent the views or opinions of any other person or entity.


