2015 Is Different
Before you prepare your “but 2008 was quite different than 2015” cards and letters, keep in mind that criticism applies to all historical references about the economy and markets; no two periods in history are “the same”. While we are not big fans of “this looks like 2011″ or this “looks like 2007″ analogies, it is fair to say many are talking about the possibility of a new bear market.
Thus, in that context, a comparison using 2007-2009 has some logical merit.
Can We Learn Anything In 2015?
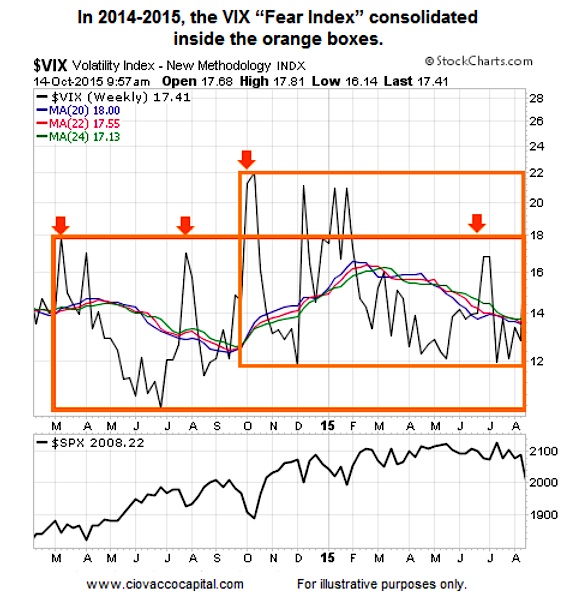
As shown in the chart of the VIX below, the VIX stayed inside the orange boxes for a long period of time – this reflects that while some market participants were optimistic, others continued to be concerned about the stock market.
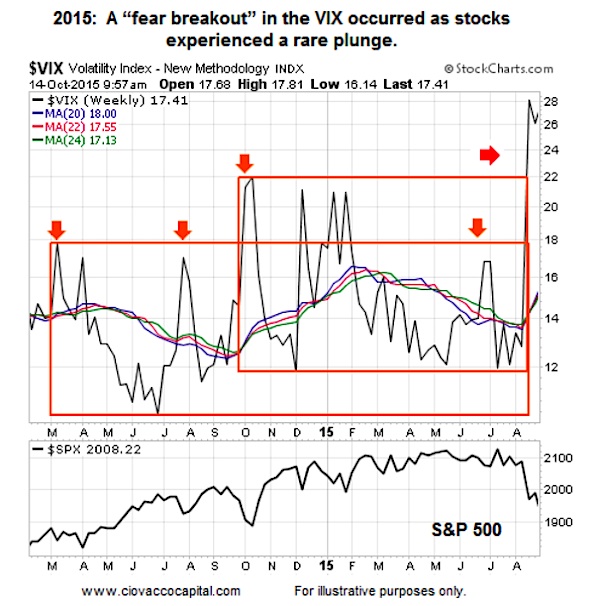
2015: A Sharp Fear Breakout
In a very short period of time in August 2015, the VIX spiked from 12 to over 26; over the same period stocks did their best impression of a waterfall.
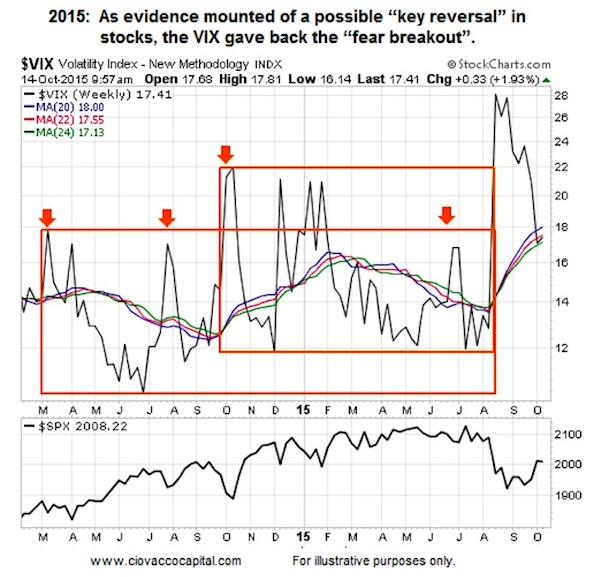
Has The Fear Breakout Held As It Did In 2008-2009?
The answer to the question above is “no”. As evidence of a possible bottoming process began to emerge on October 2, the VIX “gave back” the levels required to hold the recent breakout in fear.
How Can This Help Us?
Should we make all our decisions based on movements in the VIX? No. This analysis is one piece of evidence that should be taken in the context of the weight of the evidence. As outlined on October 13, the hard evidence has improved since October 2, but concerns remain. The markets will guide us if we are willing to listen with a flexible, unbiased, and open mind.
Thanks for reading.
Twitter: @CiovaccoCapital.
Any opinions expressed herein are solely those of the author, and do not in any way represent the views or opinions of any other person or entity.


