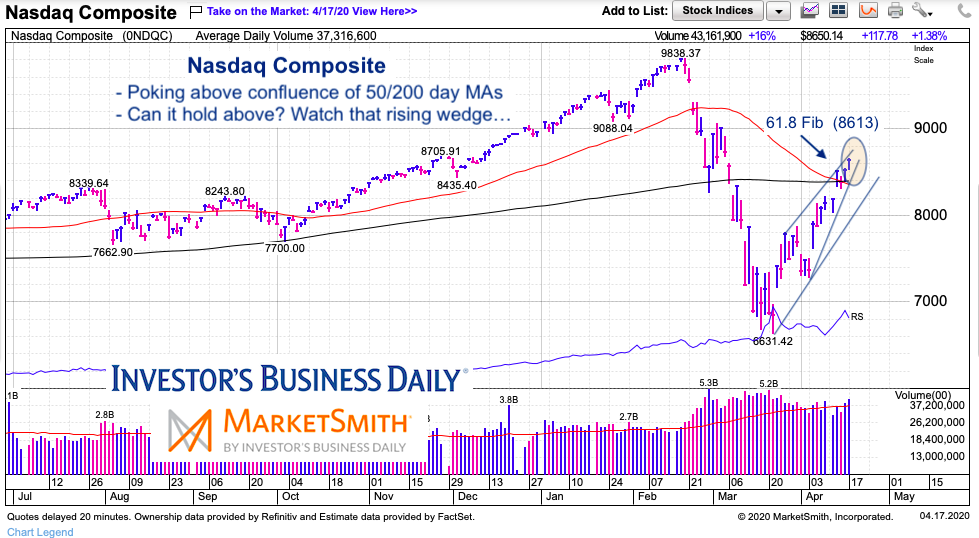
The rally has been sharp and lasted nearly 4 weeks.
With the world economy on hold, it’s hard to imagine the equities market not getting hit by a secondary storm.
With this in mind, I like to focus on leadership to see gauge the market’s health… and turning points. For me, leadership is formed with large caps and technology stocks.
So today, I highlight the Nasdaq Composite. We just finished another strong week and the index has rallied nearly 2000 points. That rally has also brought it up to an important confluence of price resistance. For this reason, investors should be on guard. More analysis below with the chart.
Note that the following MarketSmith charts are built with Investors Business Daily’s product suite.
I am an Investors Business Daily (IBD) partner and promote the use of their products. The entire platform offers a good mix of technical and fundamental data and education.
Nasdaq Composite “daily” Chart
The Nasdaq has rally reached up just above its 50 / 200 day moving averages to close a hair above its 61.8 Fibonacci retracement level. Though it’s possible that the index keeps going, that’s a lot of ground to cover in 4 weeks… with the entire global economy on hold.
There is a tight rising wedge pattern that, if broken, would lead to a test of the 4-week uptrend ling near 8000. The next strong overhead resistance area for a potential turning point is 9,000.
Tech has been the leader, so should we see a secondary “storm” hit equities I’d look for tech (Nasdaq and Nasdaq 100) to show some relative strength. It’s always best to find stocks, sectors, or indices that are showing relative strength on corrections. Whether the market pulls back here or slightly higher, it’s best to be prepared.

Twitter: @andrewnyquist
The author may have a position in mentioned securities at the time of publication. Any opinions expressed herein are solely those of the author, and do not in any way represent the views or opinions of any other person or entity.


