The quick answer to that question is that investors need to see more evidence of underlying weakness in the stock market. That said, the time for a decline is growing near.
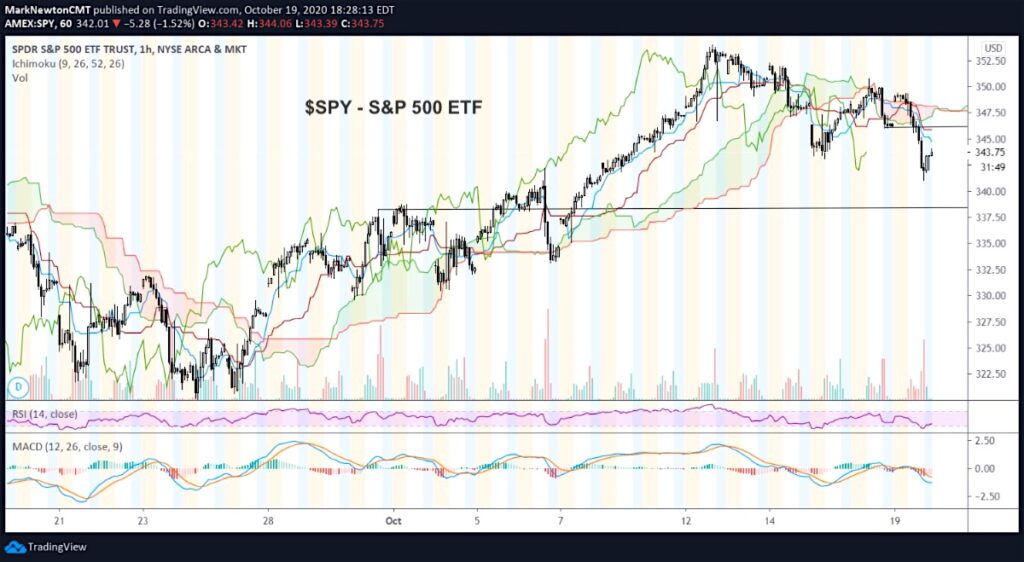
Monday’s selling saw the S&P 500 ETF (SPY) trade below last Thursday’s lows, unfolding in a three-wave decline. This is a sign of some softness in the market. There are a few key price areas to consider on the hourly chart (see below) that will factor into the the near-term price structure and outlook. On the upside, 346 carries a lot of importance. On the downside, the price support area at 338 is thought to be important. If broken, a much deeper correction would be in the cards.
As of Monday’s close, the last four of five days have been down. That said, the pullback has proven to be a very mild setback, not a sharp decline that would mark a top.

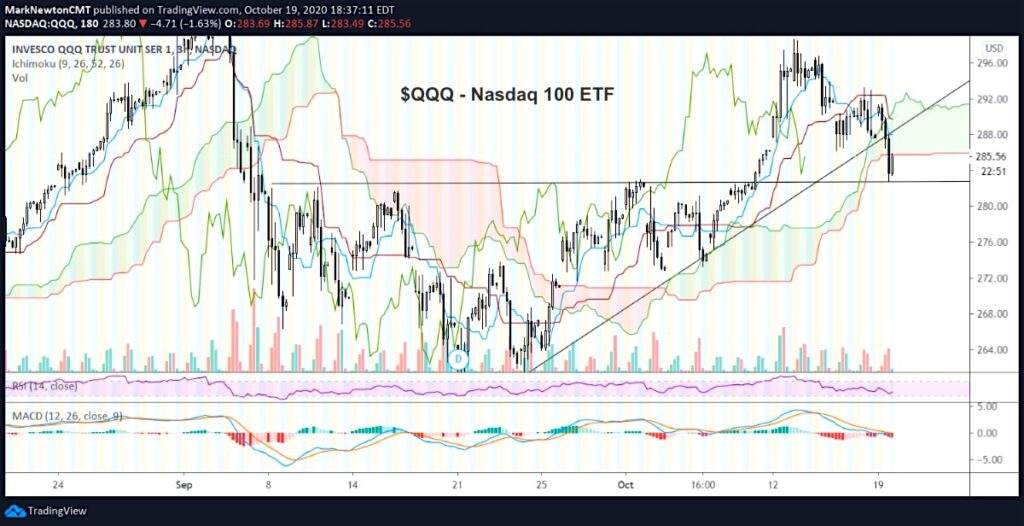
The Nasdaq 100 ETF (QQQ) similarly broke last Thursday’s lows on Monday. As well, QQQ severed its up-trend from September. These two incidents give investors reason for caution.
That said, from an Elliott wave perspective, I won’t be concerned until QQQ trades under 283 and manages to breach 280. Meanwhile, 287.61 is key price resistance now on the upside. Should it manage to trade get back above 287.61, it would allow for a push up above 293 and possibly up to the 300 to 304 area. For now, given time concerns, a rally back up would need to happen sooner than later… and lack thereof that sees further weakness should close the window on the chances for a further bounce this month.

Twitter: @MarkNewtonCMT
Author has positions in mentioned securities at the time of publication. Any opinions expressed herein are solely those of the author, and do not in any way represent the views or opinions of any other person or entity.


