The stock market has been red hot over the past 5 months or so with both the S&P 500 and Nasdaq sporting big gains.
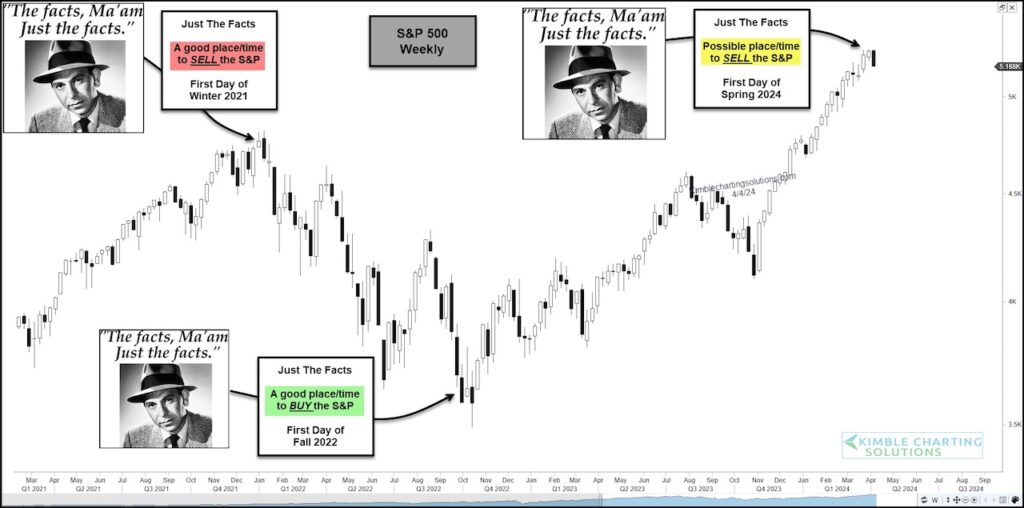
But as we will see in today’s “weekly” chart of the S&P 500 Index, sometimes the seasonal start of Winter, Spring, Summer, and Fall are times for directional changes.
“The facts, Ma’am. Just the facts.” – Joe Friday
Back on the first day of Winter in 2021, it was a good time to sell the S&P 500. And back on the first day of Fall 2022 it was a good time to buy the S&P 500. Heck, even the start of Fall of last year was a good time to buy.
Fast forward to today and it might just be a good time to sell the S&P 500 on the first day of Spring.
As you can, the S&P 500 is creating a bearish reversal bar this week. And now active investors will watch for follow on selling in the weeks ahead to see if this is a “Not Bad” time/price point to take some action. Stay tuned!
S&P 500 Index “weekly” Chart

Note that KimbleCharting is offering a 2 week Free trial to See It Market readers. Just send me an email to services@kimblechartingsolutions.com for details to get set up.
Twitter: @KimbleCharting
The author may have a position in mentioned securities. Any opinions expressed herein are solely those of the author, and do not in any way represent the views or opinions of any other person or entity.


