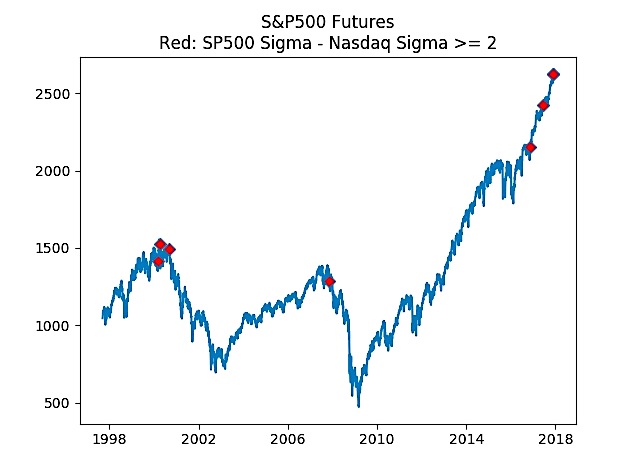
There have been noticeable divergences between the S&P 500 futures contract and the Nasdaq futures contract over the past few trading sessions.
Regardless of the narrative used by the media to explain these divergences one must wonder if this recent activity is a harbinger of things to come. Could it be signaling a long-awaited stock market correction… just as traders get giddy in anticipation of santa?
Let’s dig into the data, then take a look at it plotted on a chart of the S&P 500 (NYSEARCA:SPY).
First, let’s quantify the divergence so we are all on the same page. I like to look at price changes as z scores – which I’ve wrote about previously on this site (read this post). These z scores just express the relative price changes in normalized terms given the recent rolling historical volatility. In short, how much did price move in units of rolling volatility.
The exact method is actually pretty inconsequential because similar periods are highlighted if other methods of comparing the two contracts are used such as simple percent change differences, for example.
Regardless, there have only been a handful of times where the sigma scores have diverged by two or more sigma as calculated by S&P 500 sigma score minus the Nasdaq sigma score.
The exact dates and differences are list below:
2000-03-15 2.56
2000-04-03 2.14
2000-09-06 2.25
2007-11-08 2.16
2016-11-10 2.08
2017-06-09 2.33
2017-11-28 2.43
2017-11-29 2.53
Here is the chart:
Obviously, the graph highlights a few dates before the dot com debacle and one date prior to the Financial Crisis. We are now printing more stock market divergences than ever the past few months. Clearly we are dealing with a small sample size, but these moments of time are pretty consequential when looking at the visuals and S&P 500 chart. Intermarket signals can be very telling and are something I have touched upon before. Coincidence or is coal from Santa coming?
Over at Build Alpha, I have tools that can help anyone, even those with no programming capabilities to do simple and complex testing. Thanks for reading.
Twitter: @DBurgh
No position in any of the mentioned securities at the time of publication. Any opinions expressed herein are solely those of the author, and do not in any way represent the views or opinions of any other person or entity.


