The stock market has seen some ugly action here in 2022. But one thing has become clear: growth stocks have been battered worse than value stocks.
Within this spectrum, we can also see that technology stocks (also associated with “growth”) have performed worse than the broad market. It seems the market is “feeding” the bears tech stocks.
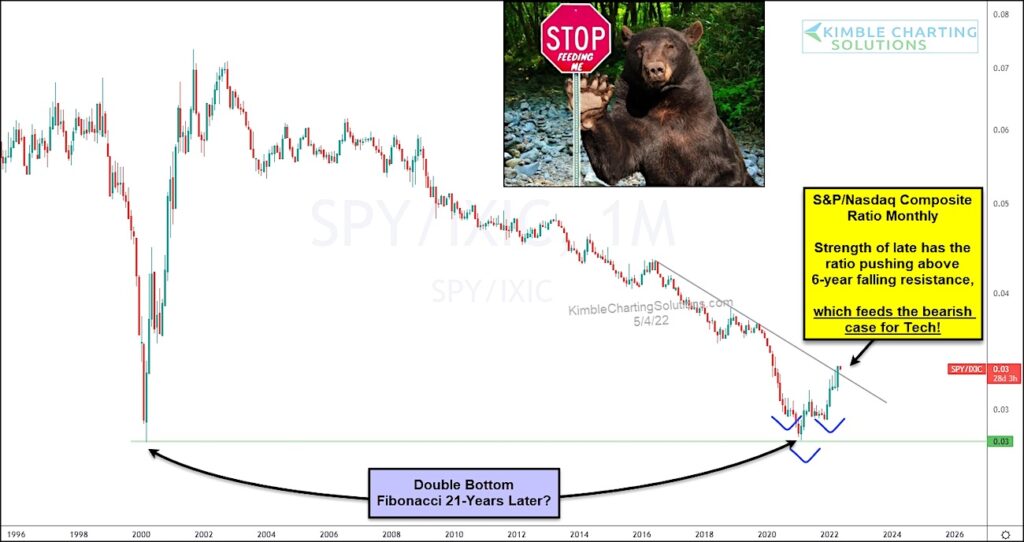
We take a closer look this theme today by looking at a long-term ratio chart of the S&P 500 Index (broad market) to Nasdaq Composite.
As you can see, the ratio has been moving higher over the past several months. This indicates that the broad market is performing better than the Nasdaq. And the rally is now attempting to break out above a 6-year downtrend line.
We must also consider that the ratio double bottomed at a key Fibonacci timing point (21 years) before turning higher.
Simply put, strength by this ratio is bearish for technology stocks. So a breakout would “feed” the bearish case for Technology stocks moving forward. Stay tuned!
S&P 500 vs Nasdaq Composite Ratio “monthly” Chart

Note that KimbleCharting is offering a 2 week Free trial to See It Market readers. Just send me an email to services@kimblechartingsolutions.com for details to get set up.
Twitter: @KimbleCharting
Any opinions expressed herein are solely those of the author, and do not in any way represent the views or opinions of any other person or entity.


