After more than a decade of decline, the Japanese Yen might have found durable support.
If the downward Elliott wave structures are indeed complete, then the Japanese Yen should make either a higher low or a sideways consolidation during the next few months before embarking upward.
Price action for the Invesco CurrencyShares Japanese Yen Trust ETF (NYSEARCA:FXY) during the past year has been consistent with the main scenario we published in August 2023. We were waiting for FXY to work its way downward through the remainder of Elliott wave (v) in preparation for an upward reversal.
Now FXY has produced a rally that could be a candidate for the first wave of some new upward pattern. The Japanese Yen Elliott wave chart shows an overview of the expected path forward, while the text describes two ways the market could provide confirmation of that scenario.
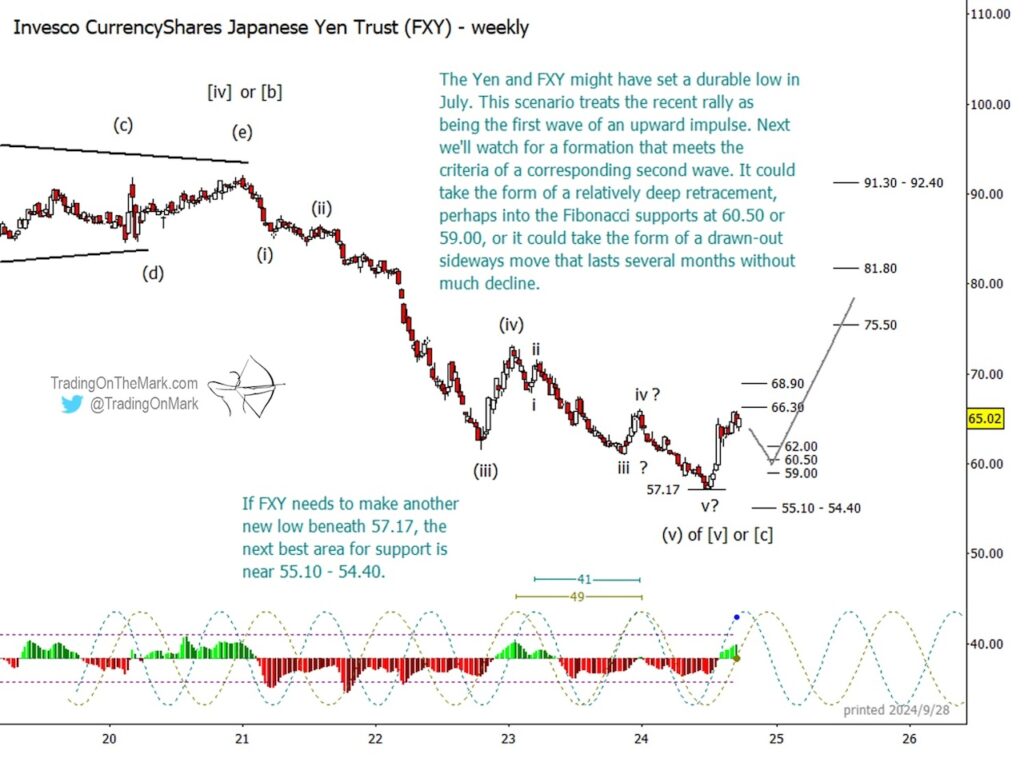
The simplest path forward would be for FXY to find resistance and then make a well-defined downward move to test the range of standard Fibonacci retracement levels. (At present, the Fibonacci retracement levels shown on the chart between 62.00 and 59.00 are based on the very recent price high, but they would change a little if price goes higher.) In this case a trader should monitor the structure of the price descent from any small high that FXY forms near the current area. Ideally the form of a second-wave correction would consist of three sub-waves going into a support zone. For bullish Yen traders, this would mean identifying chart and market signals associated with a dip.
A more tricky path would see price travel sideways beneath resistance for several months to form a shallow second wave. In that case a bullish trader would either have to wait patiently in a position or watch for signs of an upward breakout above one of the nearby resistance levels such as 66.30 or 68.90.
Another complicating factor here is the price of the Dollar itself. Our Elliott wave analysis of the Dollar Index leads us to believe it will find support near its current area and will start moving upward again soon. In that environment, even an advancing Yen will face headwinds when valued against the Dollar.
Elliott wave analysis identifies the places where the market is more likely to turn, as well as the possible target destination of a move. It also shows where price specifically should not go if the main scenario’s thesis is true. For a trader to make use of these “if this, then that” types of scenarios, it’s helpful to have guidance from people who have already integrated Elliott wave into their trading.
Our newsletter follows the Dollar Index, the Euro, and related markets on weekly and daily time frames. Now that the trading season is in full swing, Trading On The Mark is offering a subscriber special with 20% off. You can also inquire about our intraday service, which is more customized.
Twitter: @TradingOnMark
The authors may have a position in the mentioned securities at the time of publication. Any opinions expressed herein are solely those of the author, and do not in any way represent the views or opinions of any other person or entity.
: Creating Bullish Divergence?")


 and Semiconductors (SMH): Concerning Price Pattern?")


