Growth has been the dominant style for the U.S. stock market for pretty much all of the 2010s.
Based on the S&P 500 style indices, growth beat value in every year from 2007-2020 with the exception of 2012 and 2016. That is dominance, and the cherry on top was a trouncing of growth over value in 2020 of +32.0% vs -1.4%.
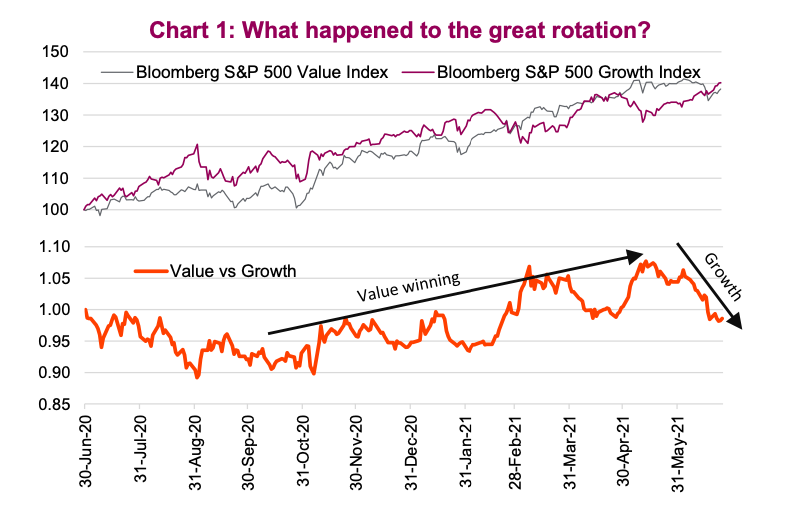
But in late 2020 the tide turned, and value started outperforming. All the stars were aligned for value including a sizeable valuation discount, the re-opening of the economy that would benefit value due to the constituents being more economically sensitive, rising yields and rising inflation. And it looked like the great value rotation had started… until the last few weeks cast some doubt.

So What About The Great Rotation?
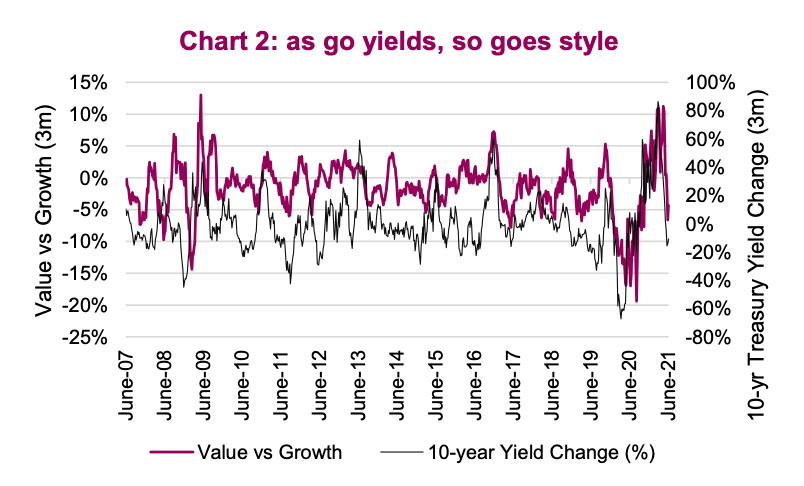
Starting in mid-May, growth began to outperform, rebounding from earlier weakness. Meanwhile value appreciation stalled. Of interest, this reversal coincided with bond yields following the same pattern. After rising since last summer, the yield on the 10-year Treasury fell from 1.70% to 1.42% a week ago. There is a pretty strong correlation between changes in bond yields and the relative performance of value and growth.
The connection is logical. Bond yields tend to rise when the economic growth prospects are improving. Better economic growth benefits value companies more than growth for a few reasons. Firstly, value has greater weights in sectors that are more cyclical. Secondly, better economic growth means more companies are growing earnings; this reduces the scarcity of growth that sometimes occurs, favouring growth stocks.
Chart 2 is the 3-month percentage change in the 10- year Treasury yield and the 3-month relative performance of value vs growth. It is not a perfect relationship but the correlation is material and significant. So even though yields have come back down a bit, if you believe yields will rise in the coming months or quarters, value remains the better style tilt.

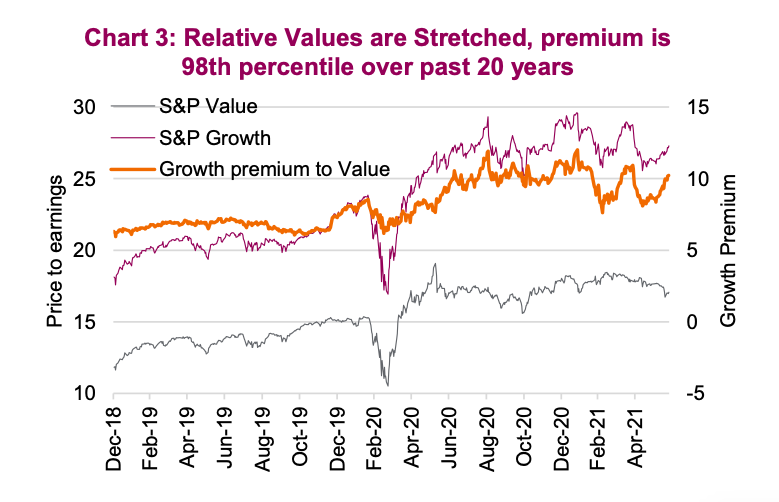
There is also no denying the valuation gap remains elevated to the extreme between value and growth. Currently, growth is trading at 27.3x and value at 17.1x forward earnings. To be fair, index valuations are market cap weighted averages of the underlying company valuations. And averages can be very misleading. For example, a person with their head in the oven and their feet in the freezer, on average should be just fine. But we know that won’t work.
A spread of 10 valuation points between value and growth is in the 98th percentile extreme based on the past twenty years (chart 3), meaning growth is very expensive compared to value. Add the yield outlook to the valuation spread, improving economic growth, improving earnings growth, inflation outlook, and these factors all favour value over growth. We believe this rotation, despite a short-term setback, is just getting started.

Source: Charts are sourced to Bloomberg L.P. and Richardson Wealth unless otherwise noted.
Twitter: @ConnectedWealth
Any opinions expressed herein are solely those of the authors, and do not in any way represent the views or opinions of any other person or entity.


