This past March, I warned about an impending stock top for Chipotle (CMG). The price patterns on the intermediate to longer term charts looked to converging near an important level. And, although Chipotle stock did have one more thrust higher, that was all she wrote.
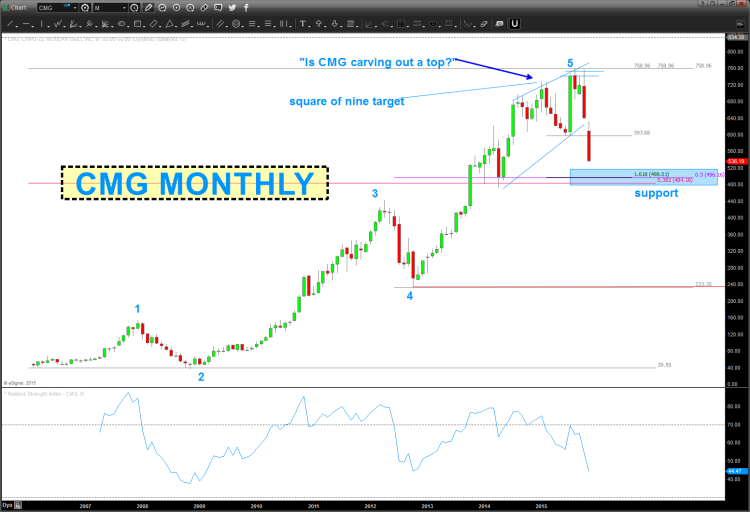
Chipotle stock price topped out in August at 758.61 before falling 532.03 yesterday. As I wrote this post, the stock began the makings of sharp rally.
To be sure, the CMG is oversold and a rally is overdue. But a more important question looms for Chipotle investors: Is the stock chart broken?
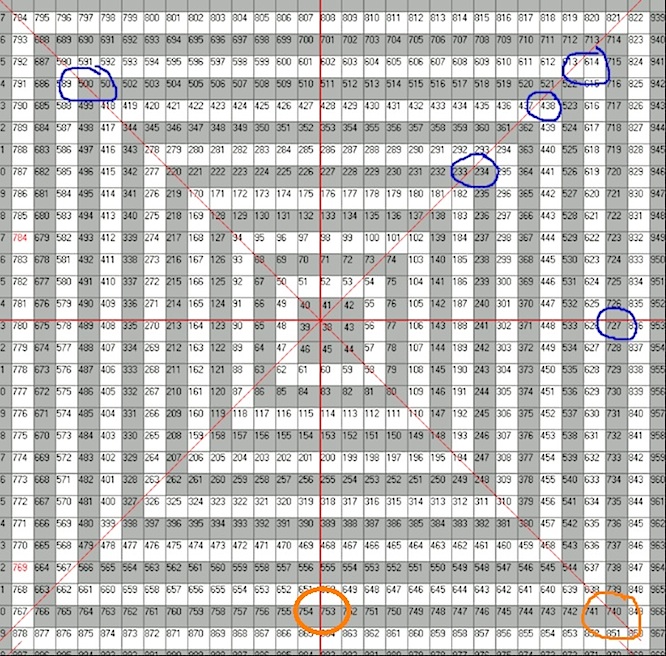
Looking at longer-term time frames you can see that the stock hit some important Fibonacci extension levels before declining sharply. Those levels also align with the Square of 9 chart below.
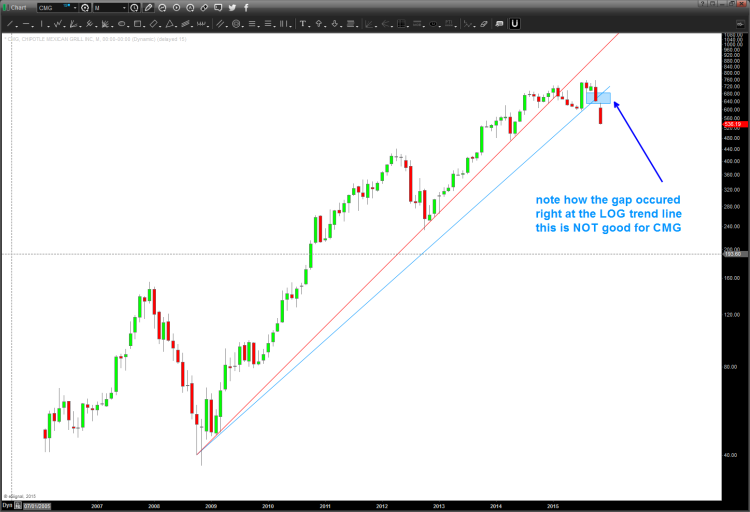
More importantly, though, the 30 percent decline in Chipotle stock also took out a key long term uptrend line, leaving bulls vulnerable.
Chipotle (CMG) Stock Charts – Monthly
Square of nine chart
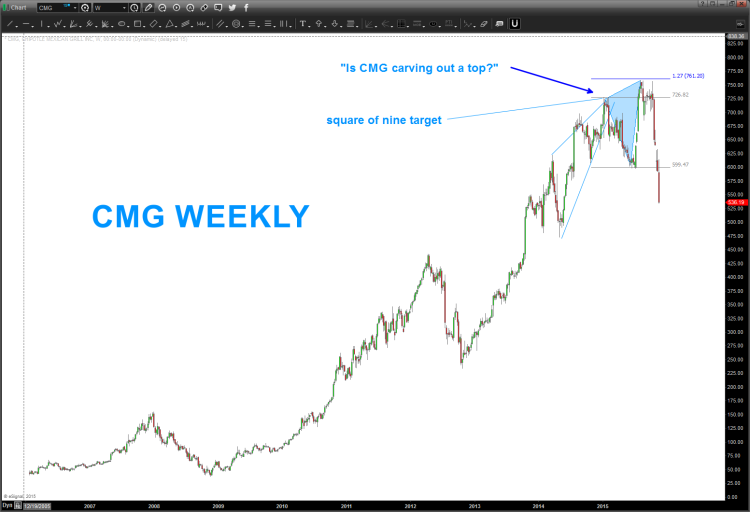
Lastly, let’s look at the weekly time frame for Chipotle (CMG). The stock chart below highlights how oversold CMG was into last week’s close. Note that a breach of the July price lows, opened the dow for another steep decline last week.
The stock price is overdue for a rally… but even in the face of a tradable rally, lower price support targets loom on the monthly chart above.
Chipotle (CMG) Stock Chart – Weekly
Thanks for reading and best of luck in the markets.
Further reading by Bart: Facebook Stock (FB) Nearing Upper Price Target
Follow Bart on Twitter: @BartsCharts
No position in any of the mentioned securities at the time of publication. Any opinions expressed herein are solely those of the author, and do not in any way represent the views or opinions of any other person or entity.


