For the past two decades, the S&P 500 Index has underperformed the Nasdaq as tech stocks have been all the rage.
Growth and innovation has transformed our economy and kept those companies (and stocks) firmly in a position of leadership.
But is tech leadership about to be up-ended?
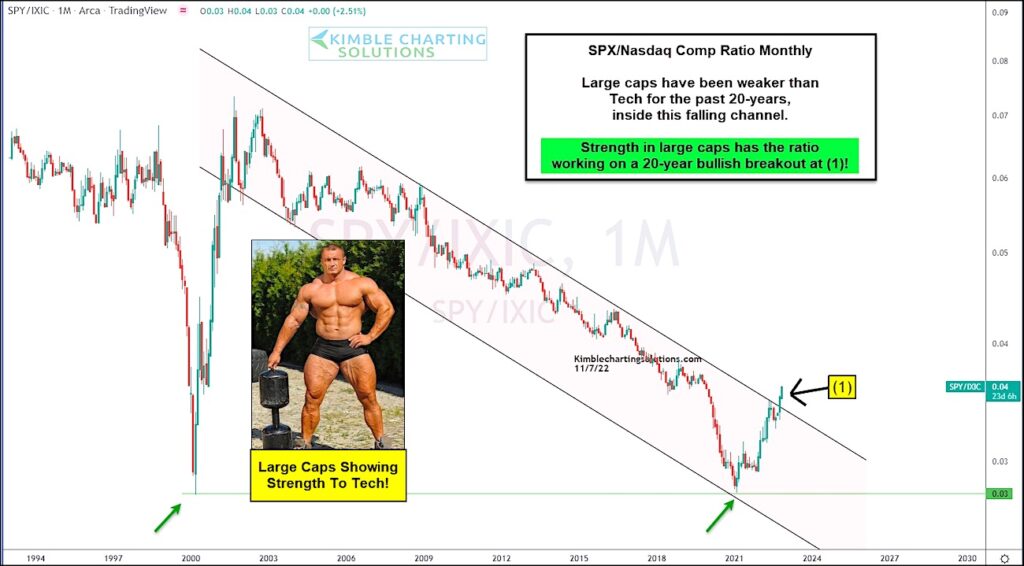
Today’s chart looks at the long-term “monthly” relationship (ratio) of the S&P 500 to Nasdaq. As you can see, the S&P 500 Index has underperformed the Nasdaq for nearly 2 decades!
BUT the broad large cap index has been out-performing the nasdaq for several month and the ratio is breakout out of its downtrend channel at (1). This comes after a potential double bottom formation. Are large caps set to out-perform tech stocks in months/years ahead? Stay tuned!!
S&P 500 Index / Nasdaq Composite Ratio “monthly” Chart
Note that KimbleCharting is offering a 2 week Free trial to See It Market readers. Just send me an email to services@kimblechartingsolutions.com for details to get set up.
Twitter: @KimbleCharting
Any opinions expressed herein are solely those of the author, and do not in any way represent the views or opinions of any other person or entity.


 Having Its Day: What’s Next?")
